VC MapVC StoryWebinar
“Radwege3D” Vienna: Making Mobility Planning Understandable
How can large-scale infrastructure projects be communicated clearly and convincingly? Together with the City Survey Department of Vienna, we explored this question in our joint webinar and demonstrated how the “Radwege3D” project brings mobility planning to life through an interactive 3D web application built with VC Story.
The joint webinar hosted by Virtual City Systems and the City Survey Department of Vienna on October 22, 2025, offered in-depth insights into the development, implementation, and impact of the “Radwege3D” project. The central question: How can a complex infrastructure project like Vienna’s current and planned bicycle routes be made accessible, tangible, and engaging for the public?
A Digital Approach to Mobility Planning – Vienna as an Example
Hubert Lehner (Head of 3D Modeling and Services, City Survey Department of Vienna) opened the session by introducing the project idea: Vienna’s mega bike highway, stretching from the Prater to Donaustadt, was to be visualized in a way that clearly shows its impact on the urban environment. The result was a guided 3D story created using VC Story and VC Map, enabling users to experience the route virtually from a cyclist’s perspective.
Charlotte Glatz (3D Modeling and GIS, City Survey Department of Vienna) followed with a presentation on the data preparation workflows required to model the road space realistically. Florian Federhofer (Technician, City Survey Department of Vienna) added insights on optimizing the application for mobile use and integrating technical features such as before-and-after images and 3D object rendering.
Technical Implementation with VC Story and VC Map
Patrick Würstle (Software Developer for Urban Simulation, Virtual City Systems) demonstrated how the application was implemented from a technical standpoint. A key focus was the synchronization of the animated cyclist with the camera flights. To meet this challenge, the team used the CZML format alongside a custom-developed conversion workflow.
Patrick also presented early prototypes of a future editor that will allow users to create 3D stories like these directly within VC Map.
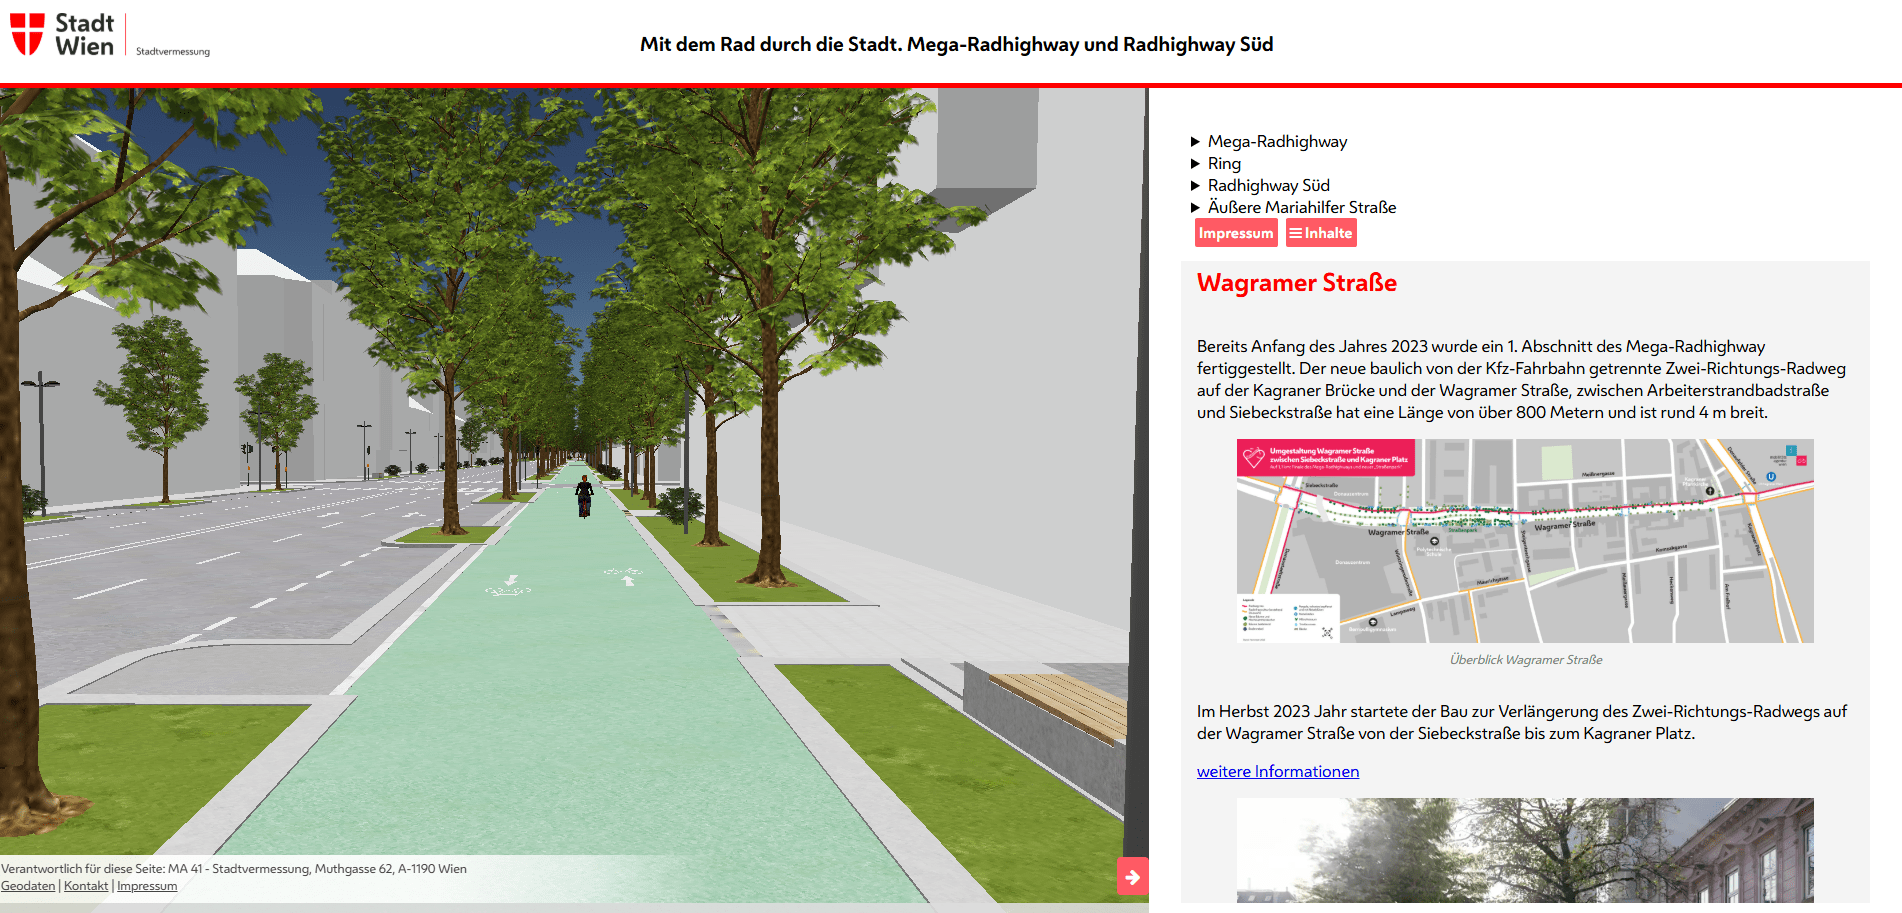
Image: Mega-Radhighway and Radhighway Süd, as central traffic axes, are the focus of VC Story. In addition to the 3D representation, there are explanations of the individual sections and projects, 2D map material, photos, and further links.
Practical Questions and Real-World Insights
The following Q&A session explored both technical and content-related questions. Participants asked about the templates used, mobile display options, and the underlying data for the 3D models. One key area of interest was how much of the bicycle route network had already been completed and how the digital story compared with reality on the ground.
A Model for Other Cities
In conclusion, it became clear: “Radwege3D” is not only a compelling example of digital mobility planning but also a powerful argument for the use of Urban Digital Twins in city communication. The project demonstrates how complex planning data can be turned into relatable stories that resonate with both internal and public stakeholders.
For more background, check out our full article on the “Radwege3D” project.
Did you know?
We also use VC Story ourselves – for example, in our interactive VC Story celebrating 20 years of Virtual City Systems. In this retrospective, we look back on two decades of innovation in 3D geospatial data, highlight key milestones, and show how our products have evolved – all presented in an engaging storytelling format with animated camera flights and interactive content.
(Please note: The following VC Story is available in German only.)