1. Creation of a story slide using the drawing tool (Step A)
VC Story
Interactive map stories for presenting geospatial data and projects
What is VC Story and what is it used for?
The VC Story is a presentation and communication layer for web maps based on VC Map. It combines map content with text, images, and other HTML elements to convey geospatial data and projects in a clear and audience‑specific way.
It is aimed at organizations such as municipalities, planning authorities, smart city initiatives, and service providers in the fields of geodata and participation that want to structure and communicate their content effectively.
How does VC Story work?
A VC Story links content with the logic of a map application:
- Content is combined with map views
- Actions automatically control the map view, for example by switching viewpoints, layers, or visual styles
- Users are guided through content and map views – either manually or automatically
Two presentation formats can be used:
- Slides: Content is displayed as individual windows positioned on the map
- Scroll story: Content is presented as a continuous section alongside the map

“With VC Story, we can present relationships in a clear and intuitive way and make the value of standardized data models easy to understand, as the content is always visible in its spatial context. XPlanung, as a binding standard, offers clear benefits for the exchange and further processing of planning data—yet its structures are not always self-explanatory.”
Ceation with the VC Story Editor
VC Stories are created in VC Publisher using the VC Story Editor. The editor is integrated as an extension in the App Configurator and enables creation through a graphical user interface – without programming.
The VC Story Editor supports:
- The creation and editing of content such as text, images, and HTML-based content like videos or embeds
- Linking content with map functions, for example by switching viewpoints, layers, visual styles, or plugins
- Synchronizing map views and story content
- Choosing between two presentation formats: slides for step-by-step content or a scroll story for a continuous, coherent narrative
- Configuring navigation and interaction, for example by defining the sequence of content, navigation options, and interactions between story and map
- The use of autoplay and loop functions for automatic and recurring playback of the story, for example for presentations or displays
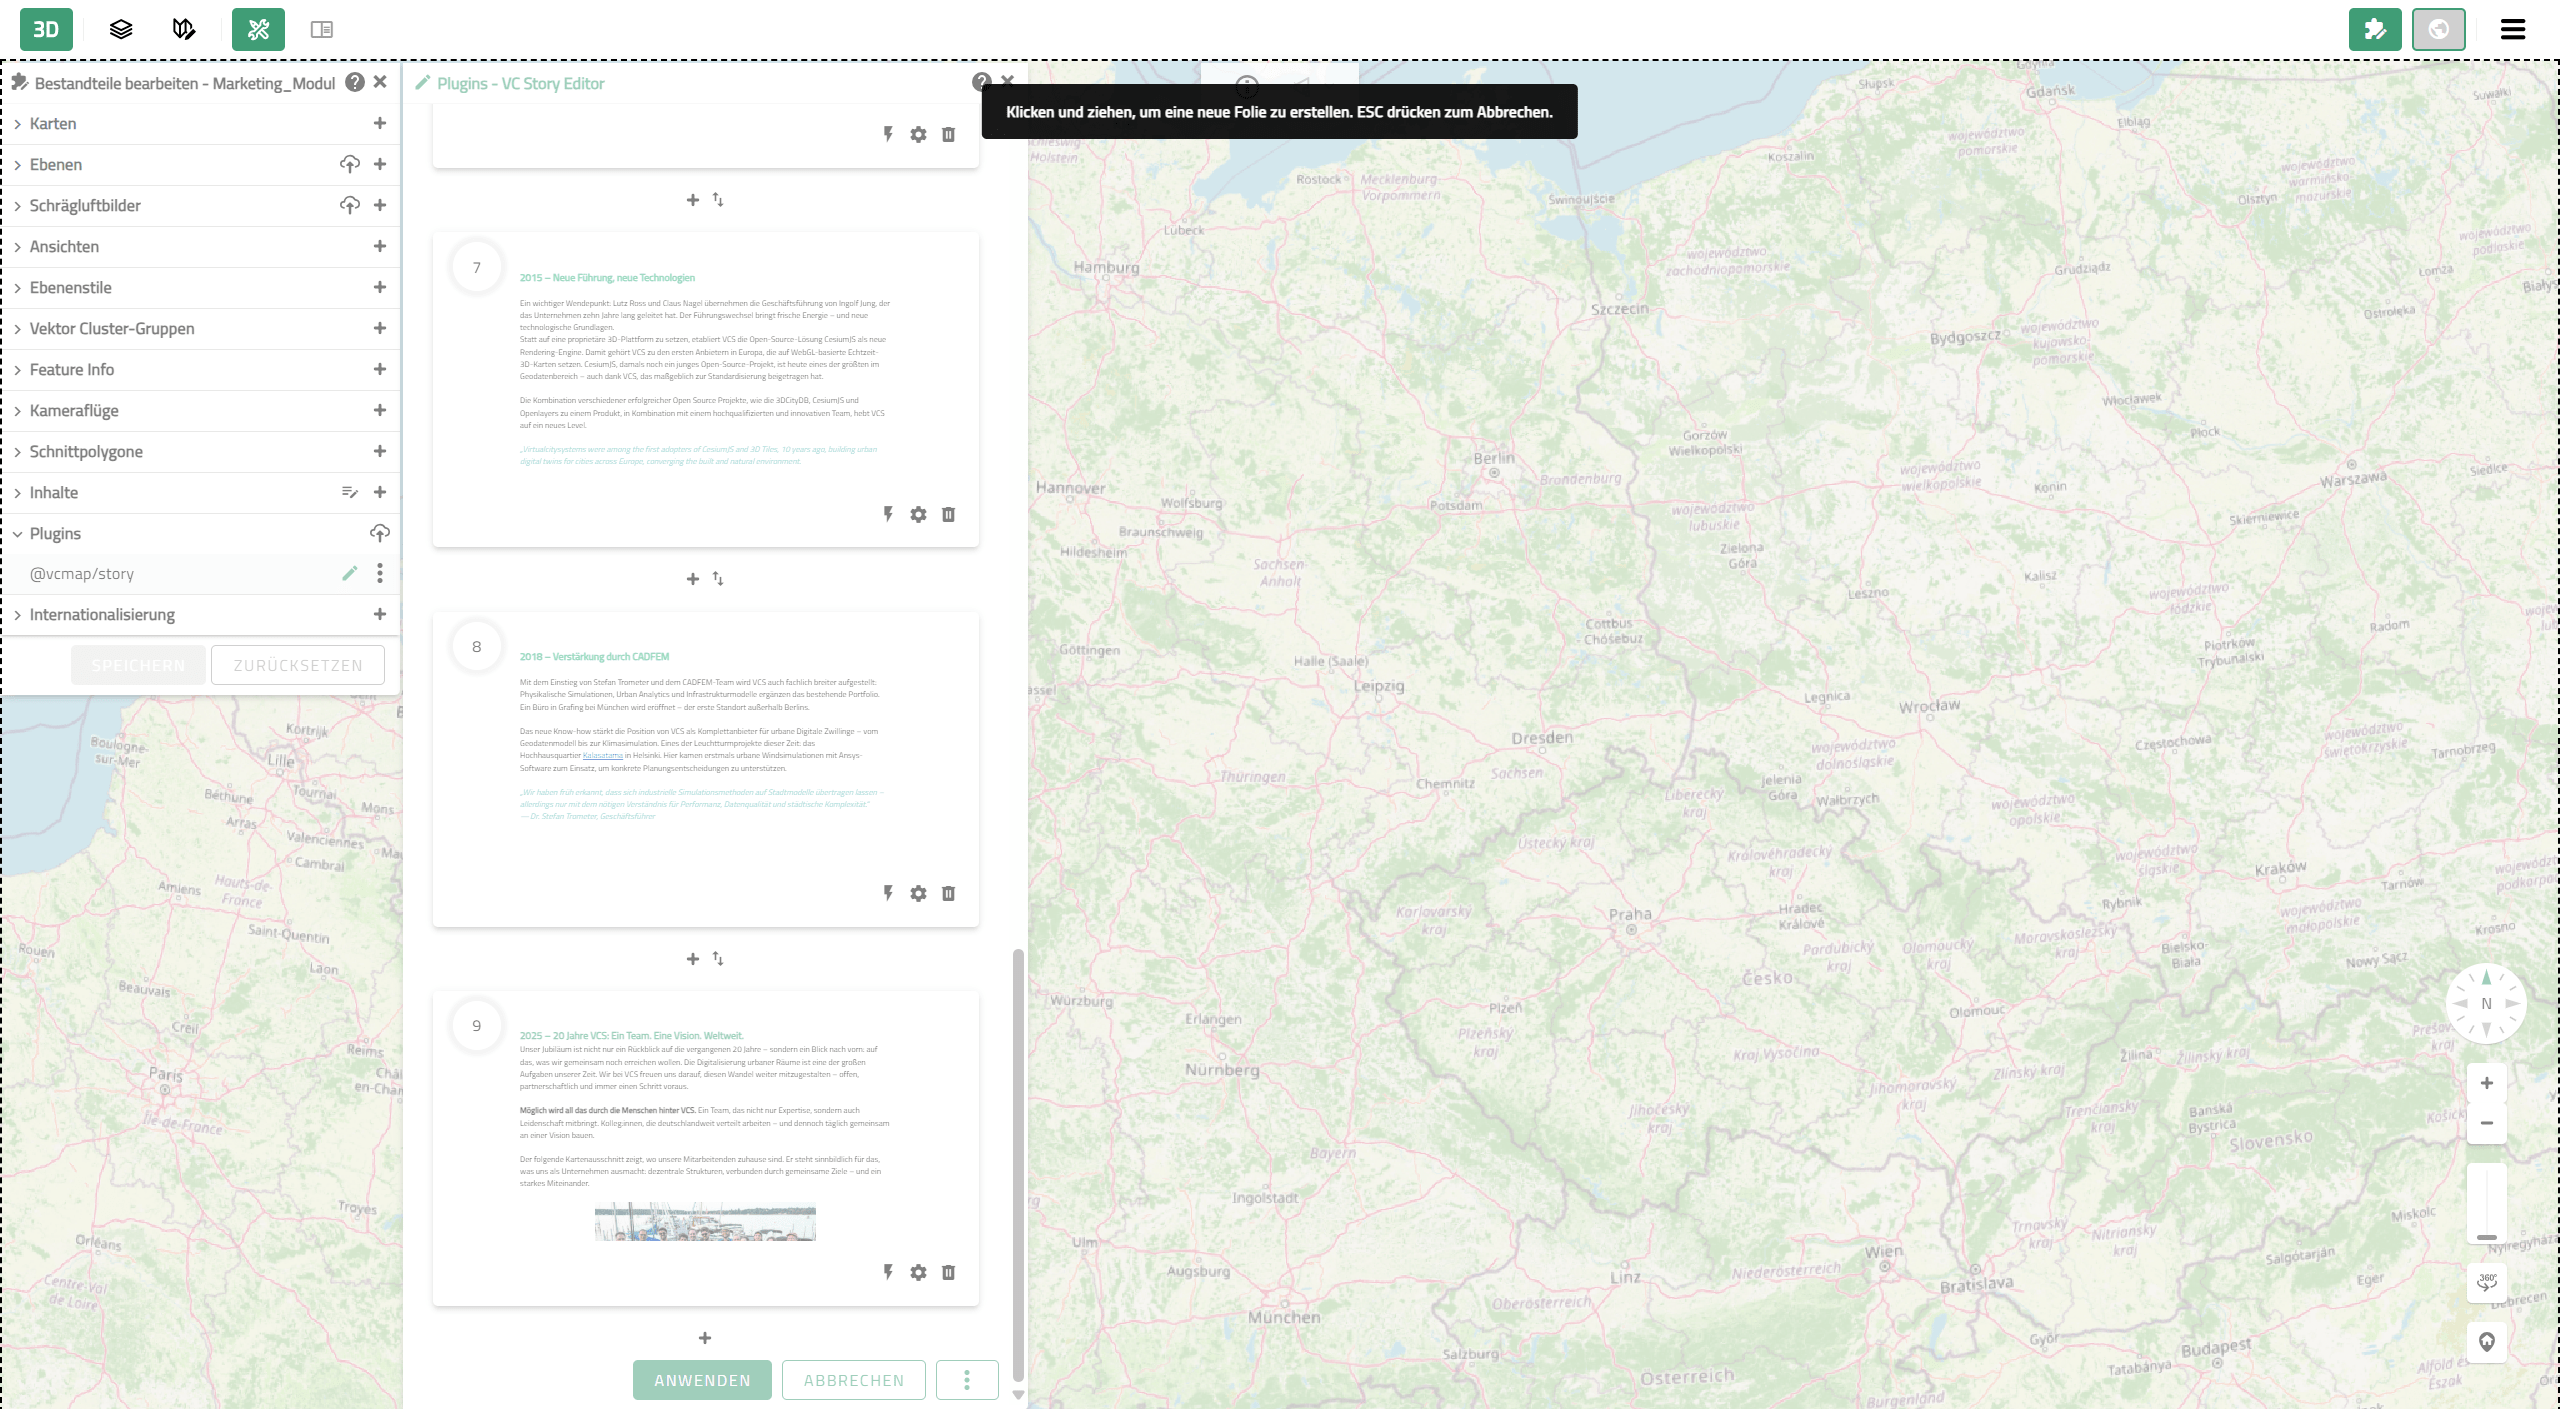
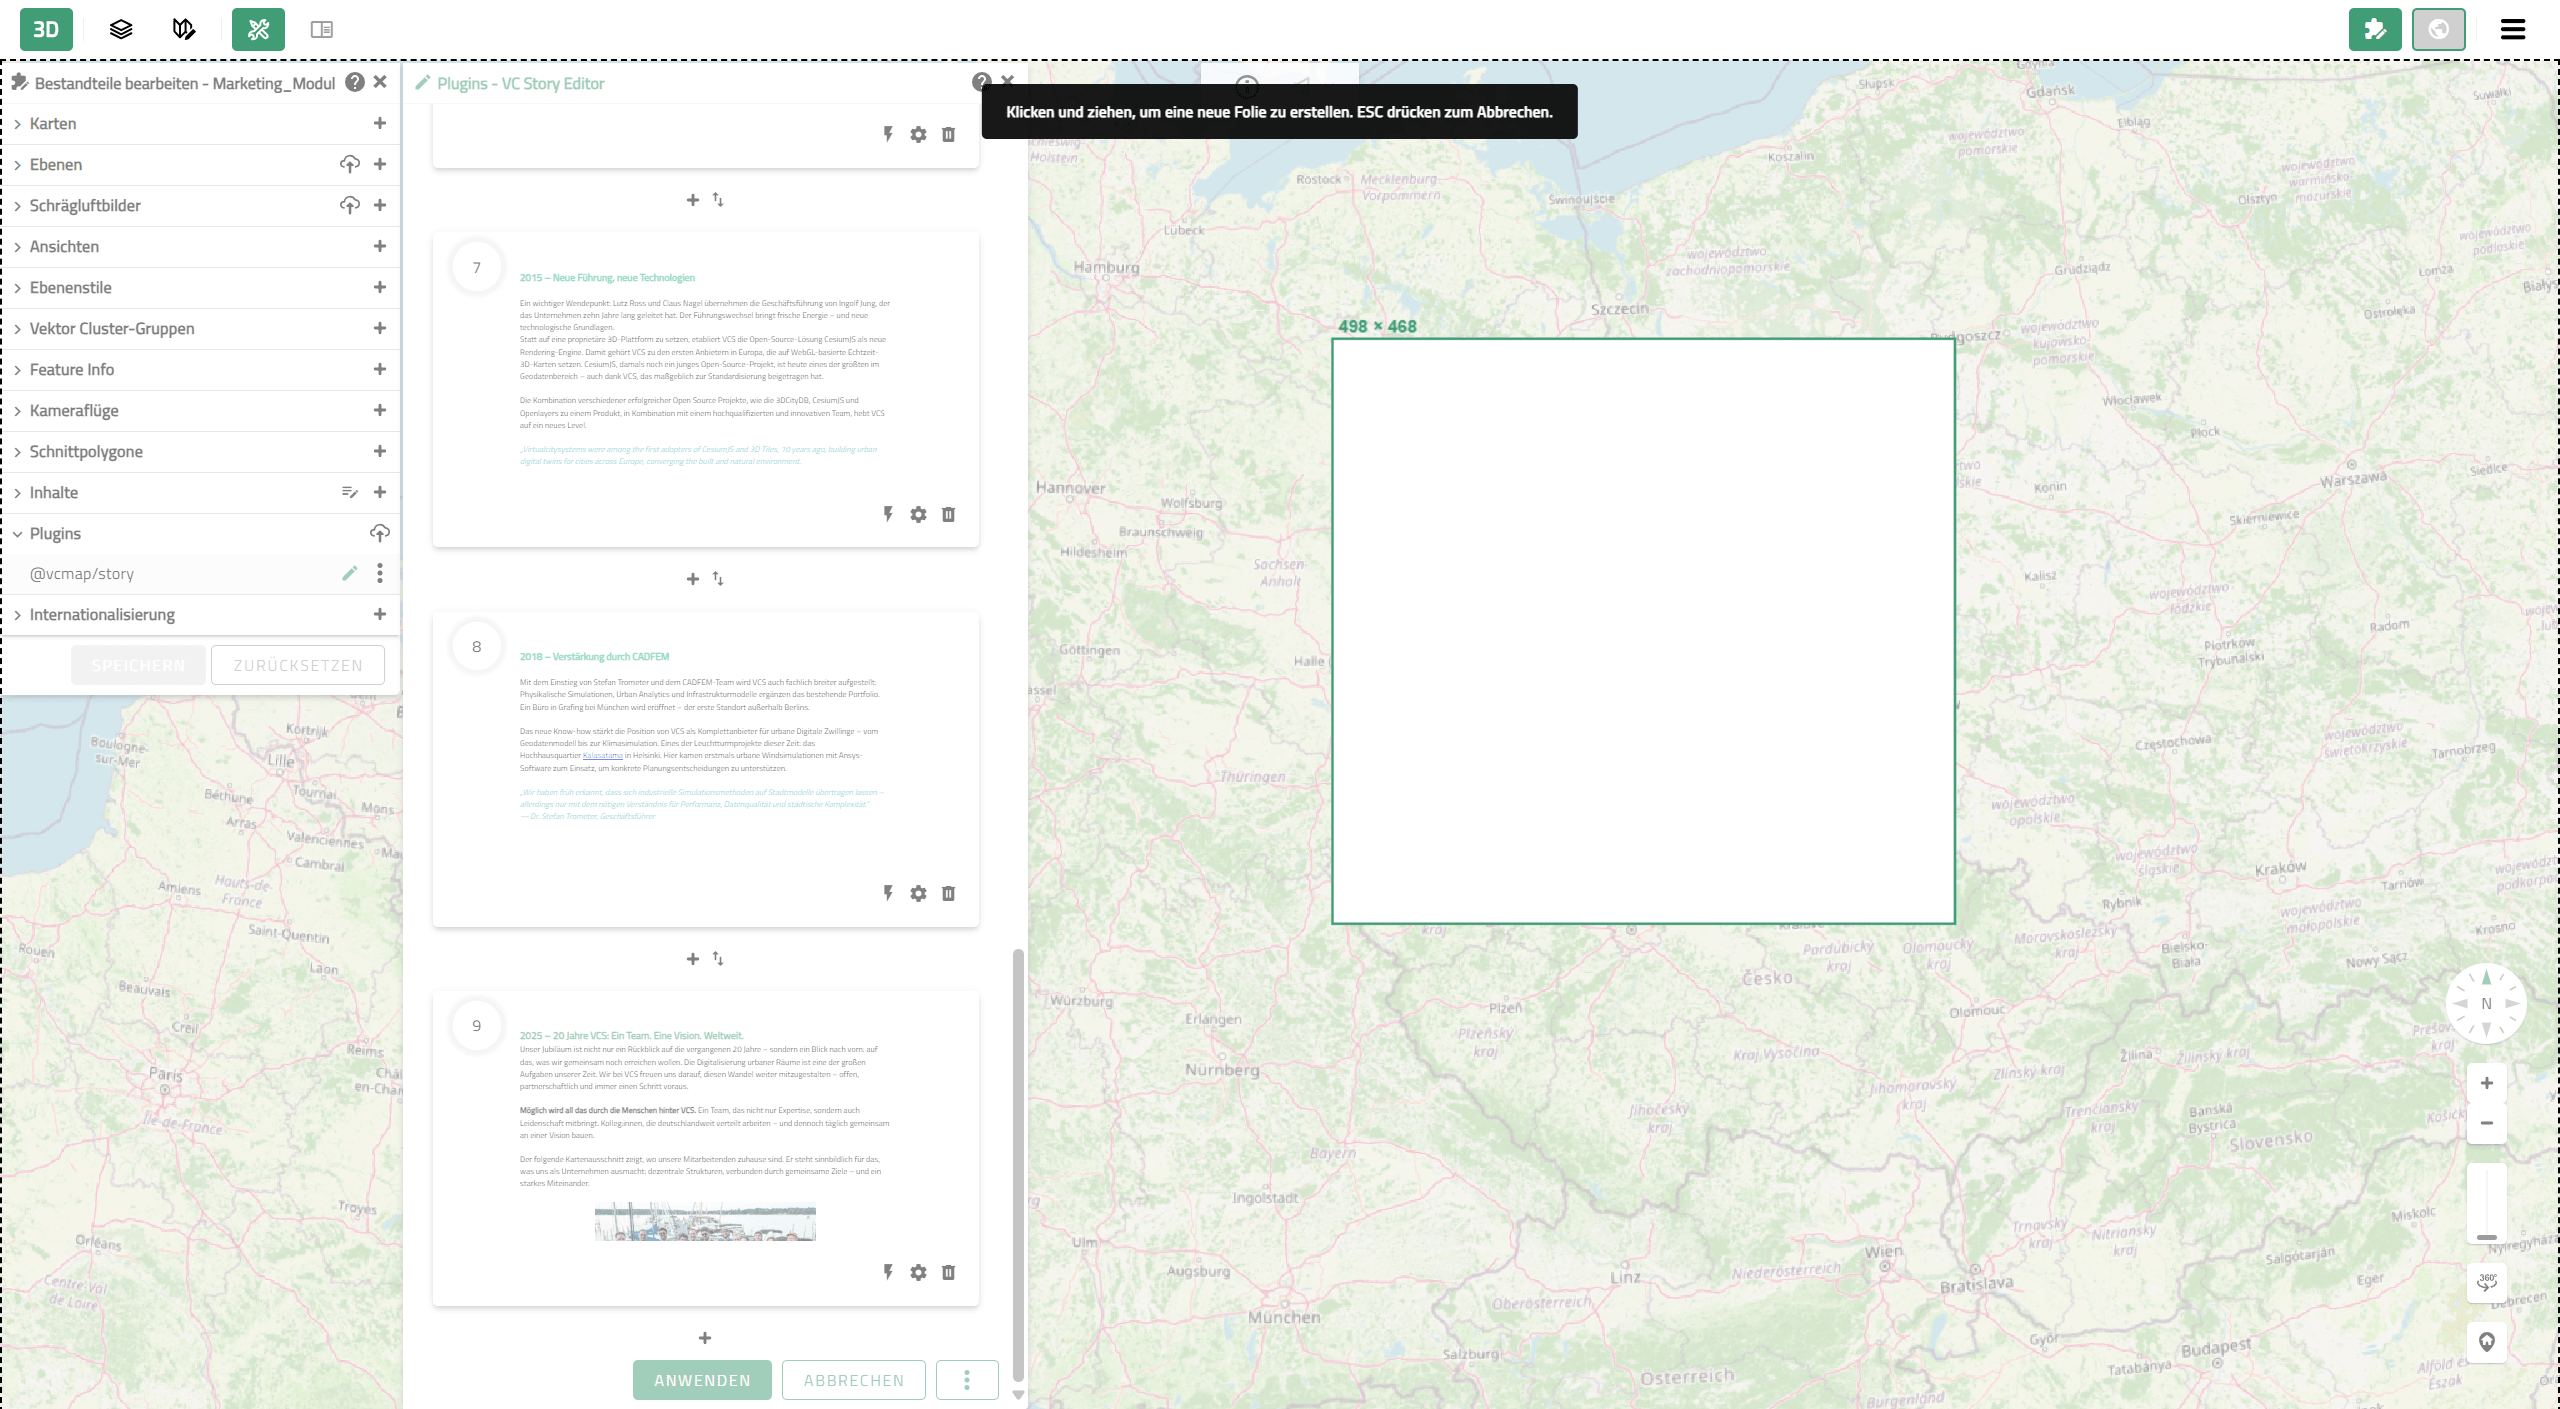
2. Creation of a story slide using the drawing tool (Step B)
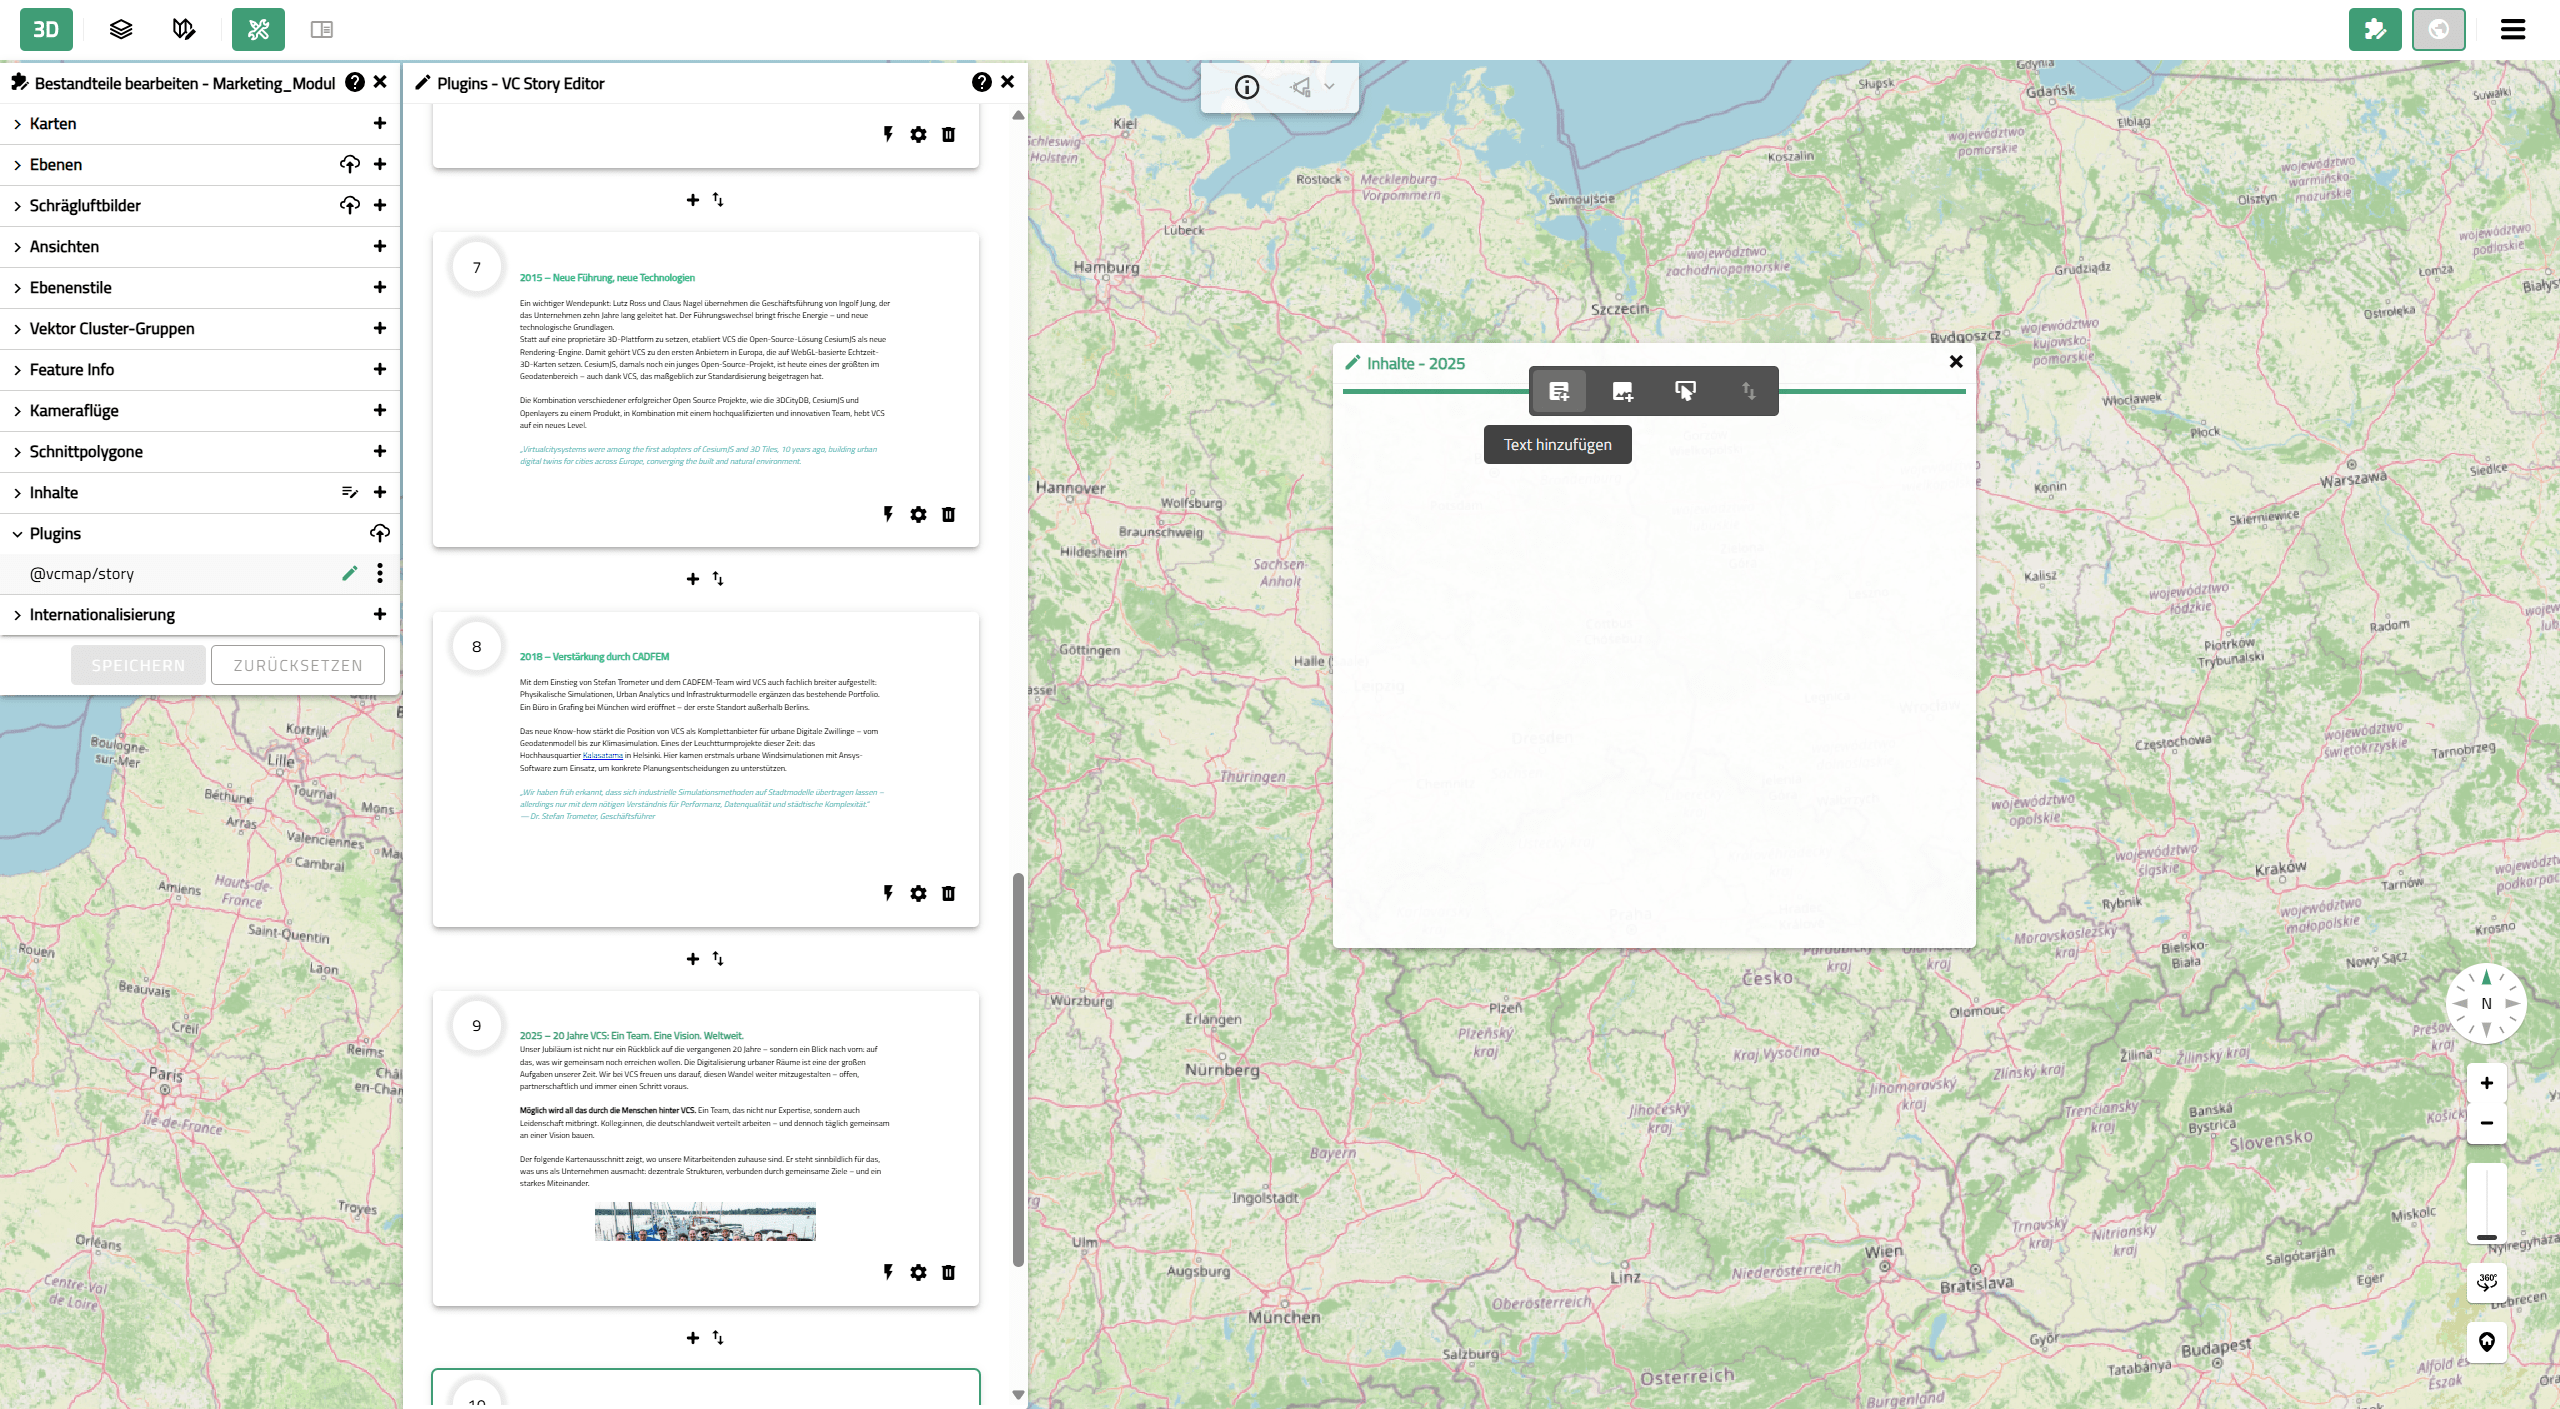
3. Inserting initial content into a story section
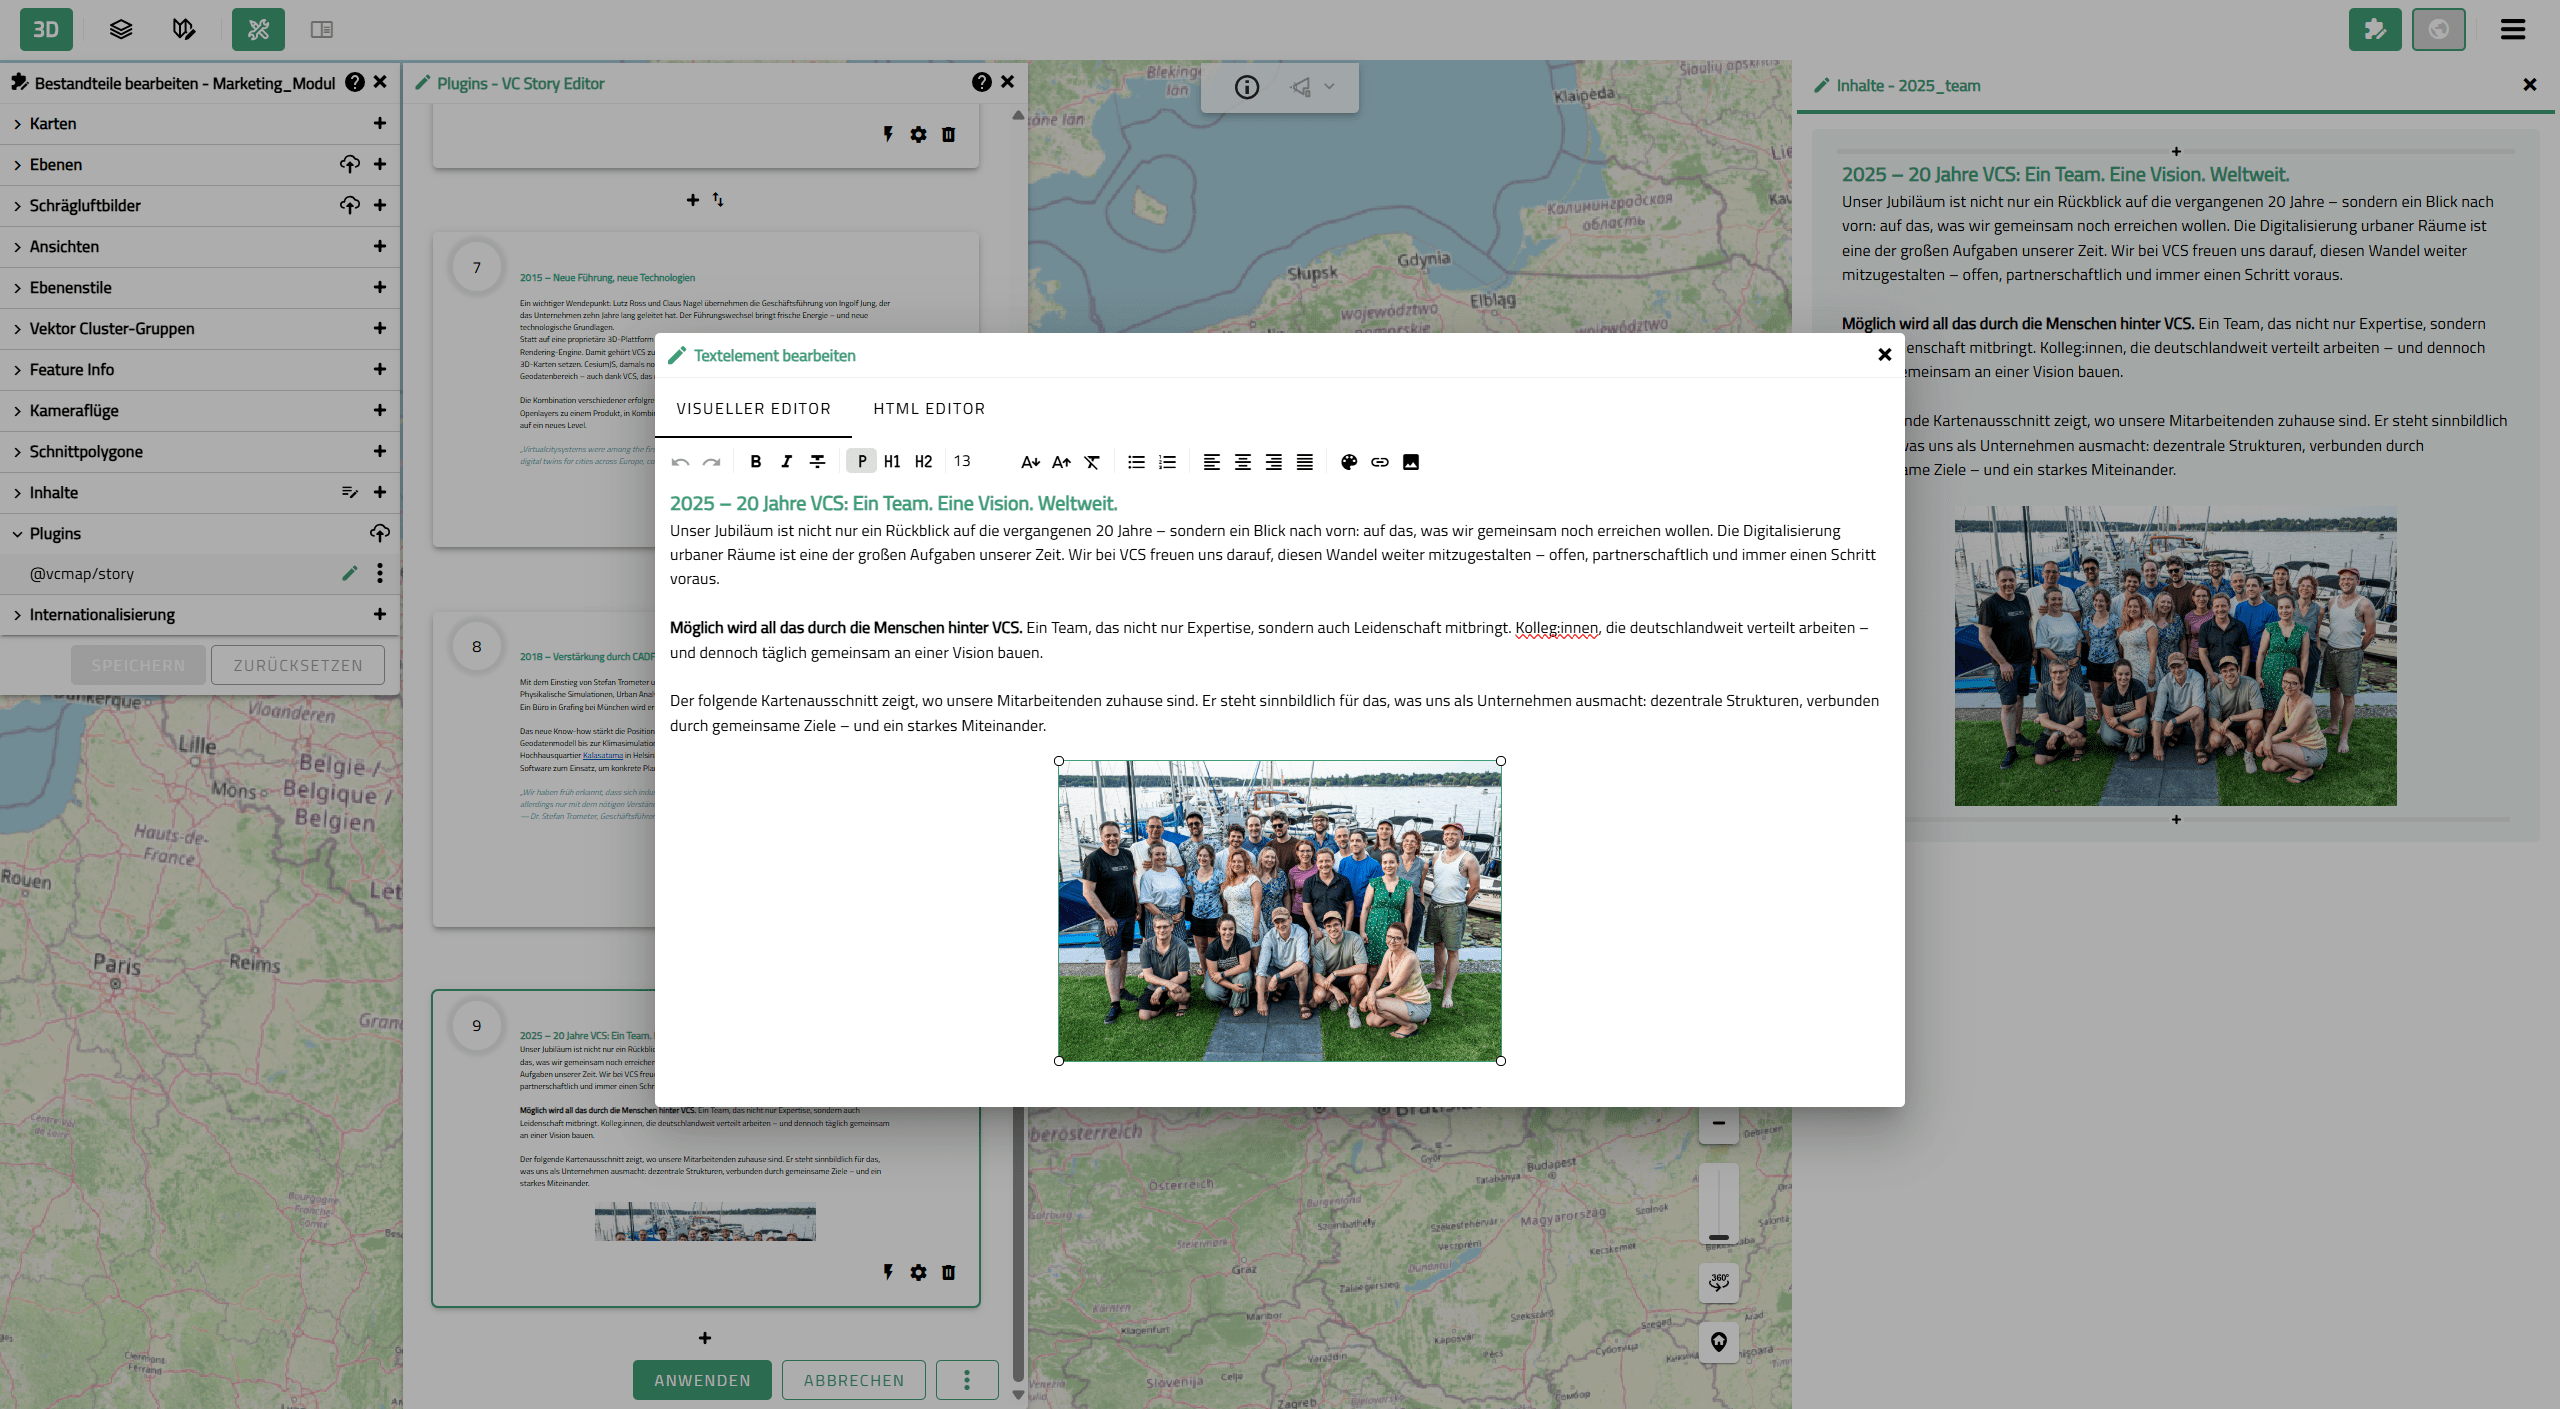
4. Editing text and images in the visual editor
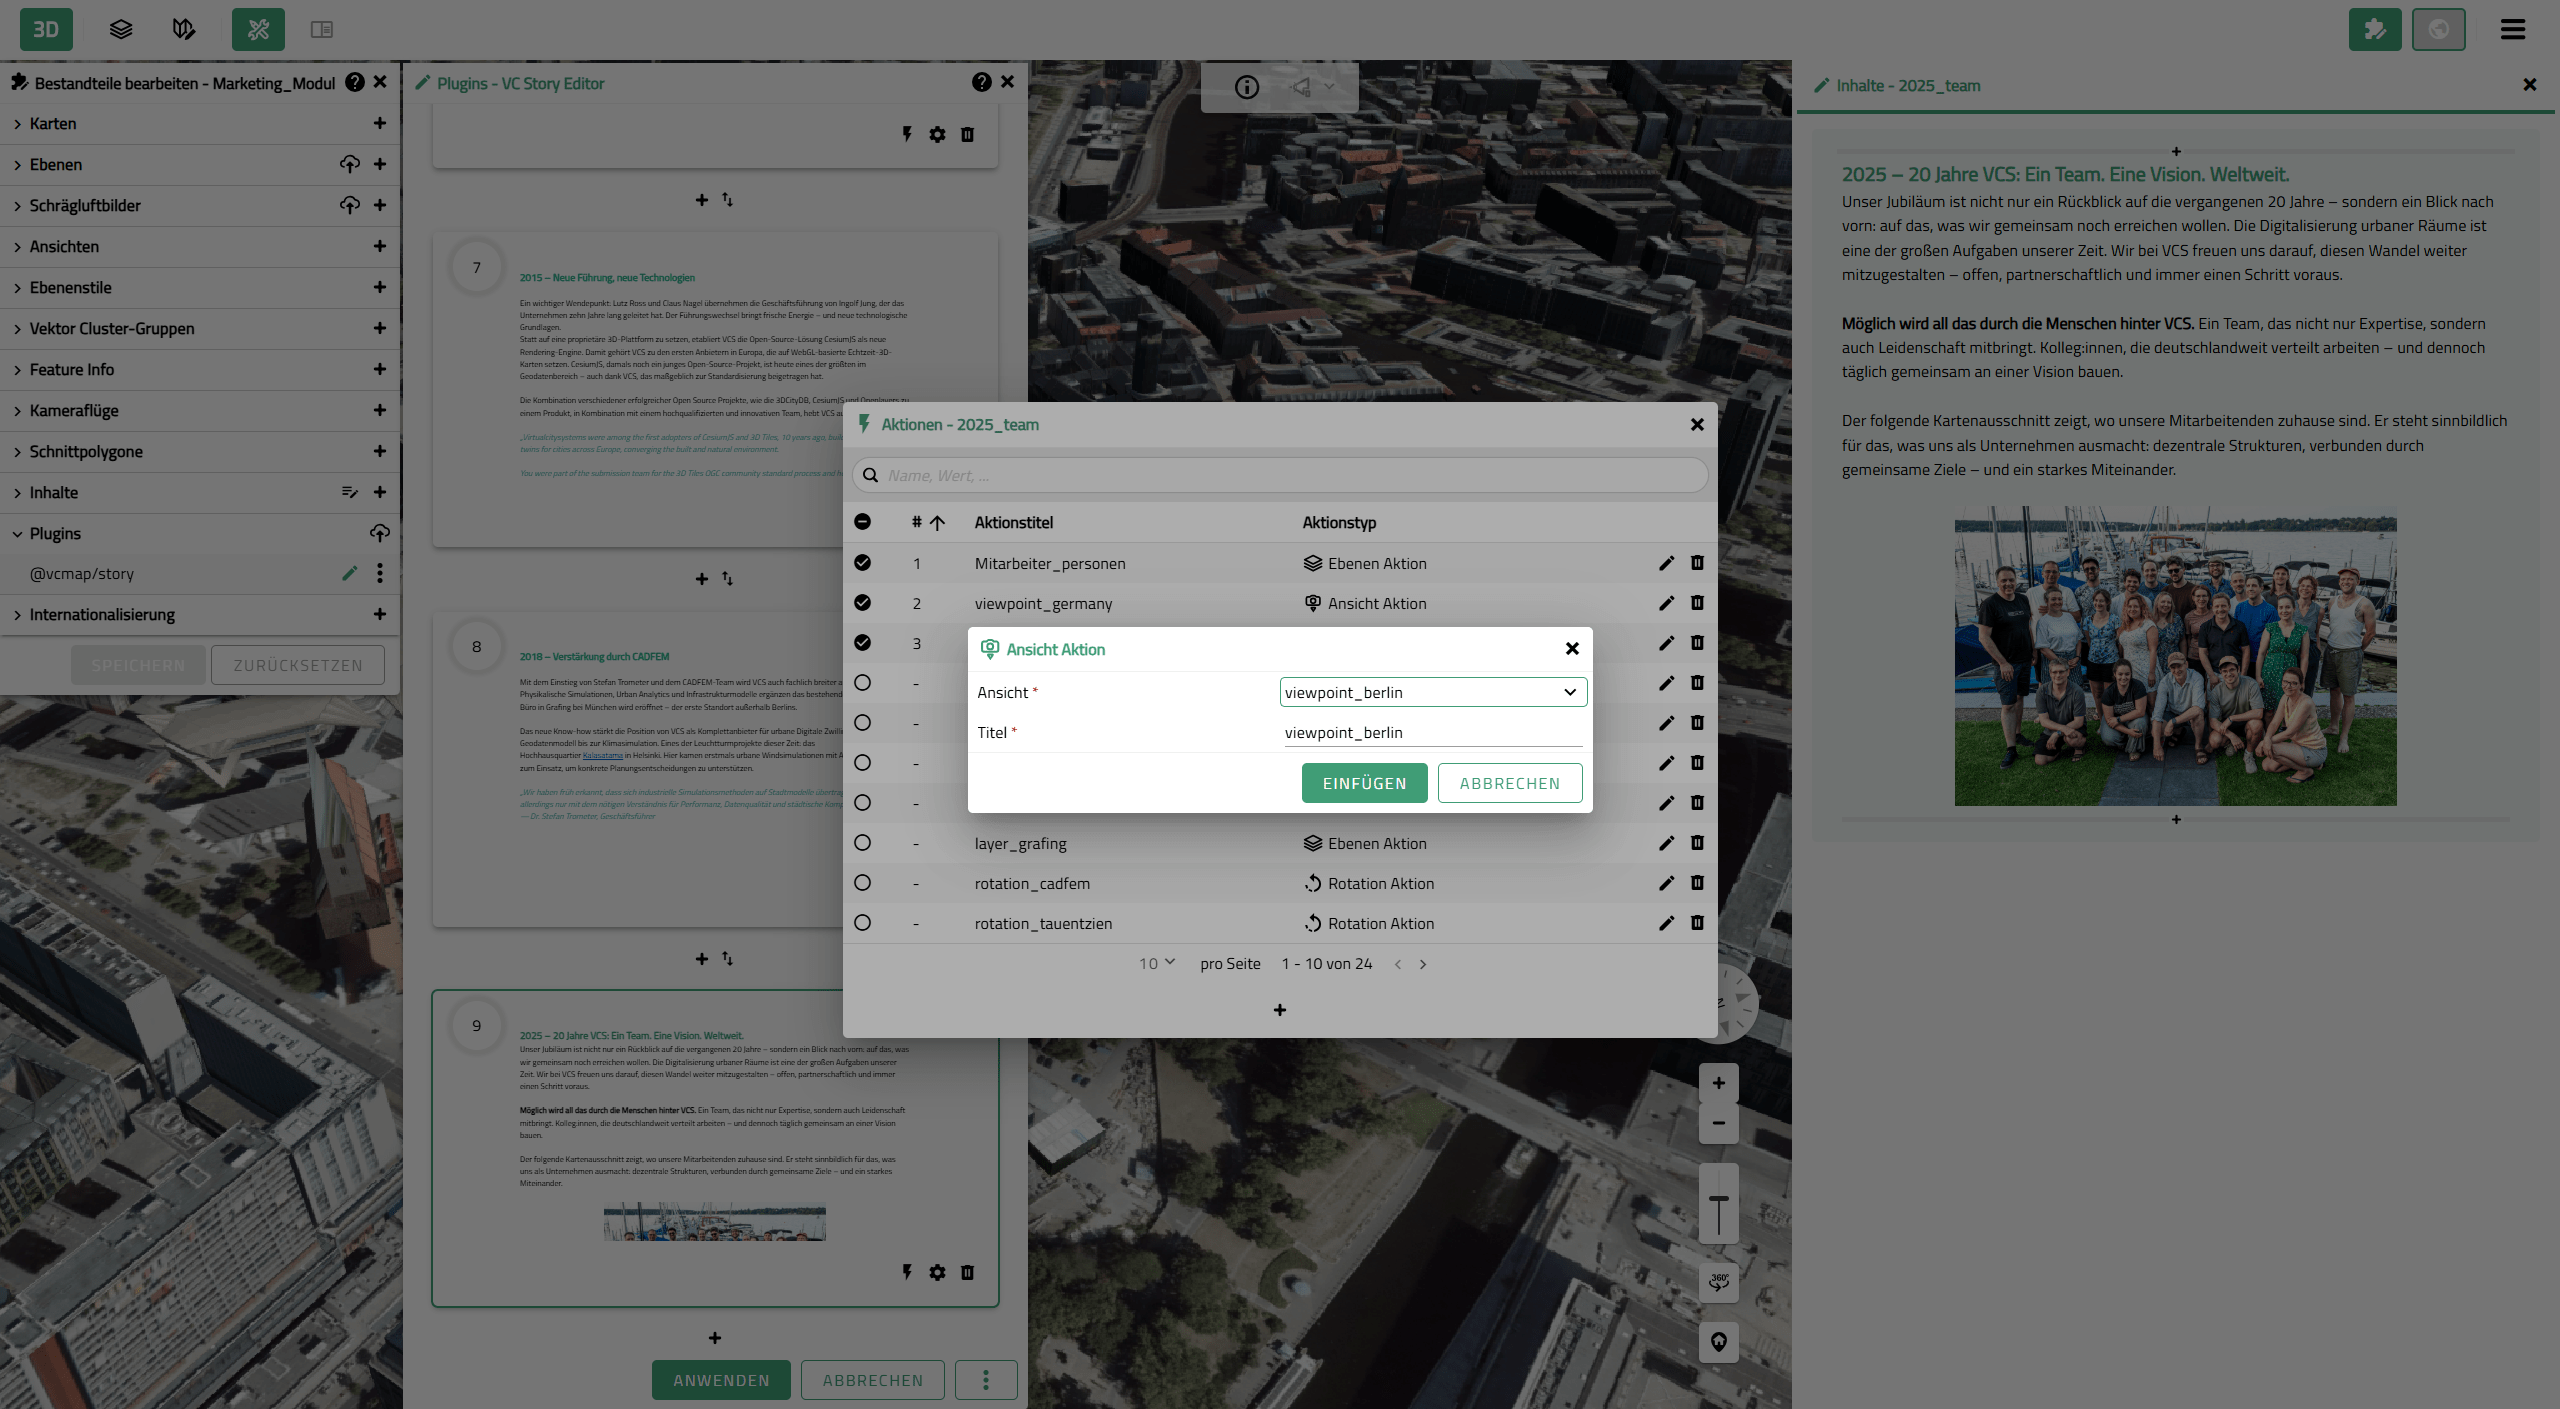
5. Selection of a map view fpr a map action
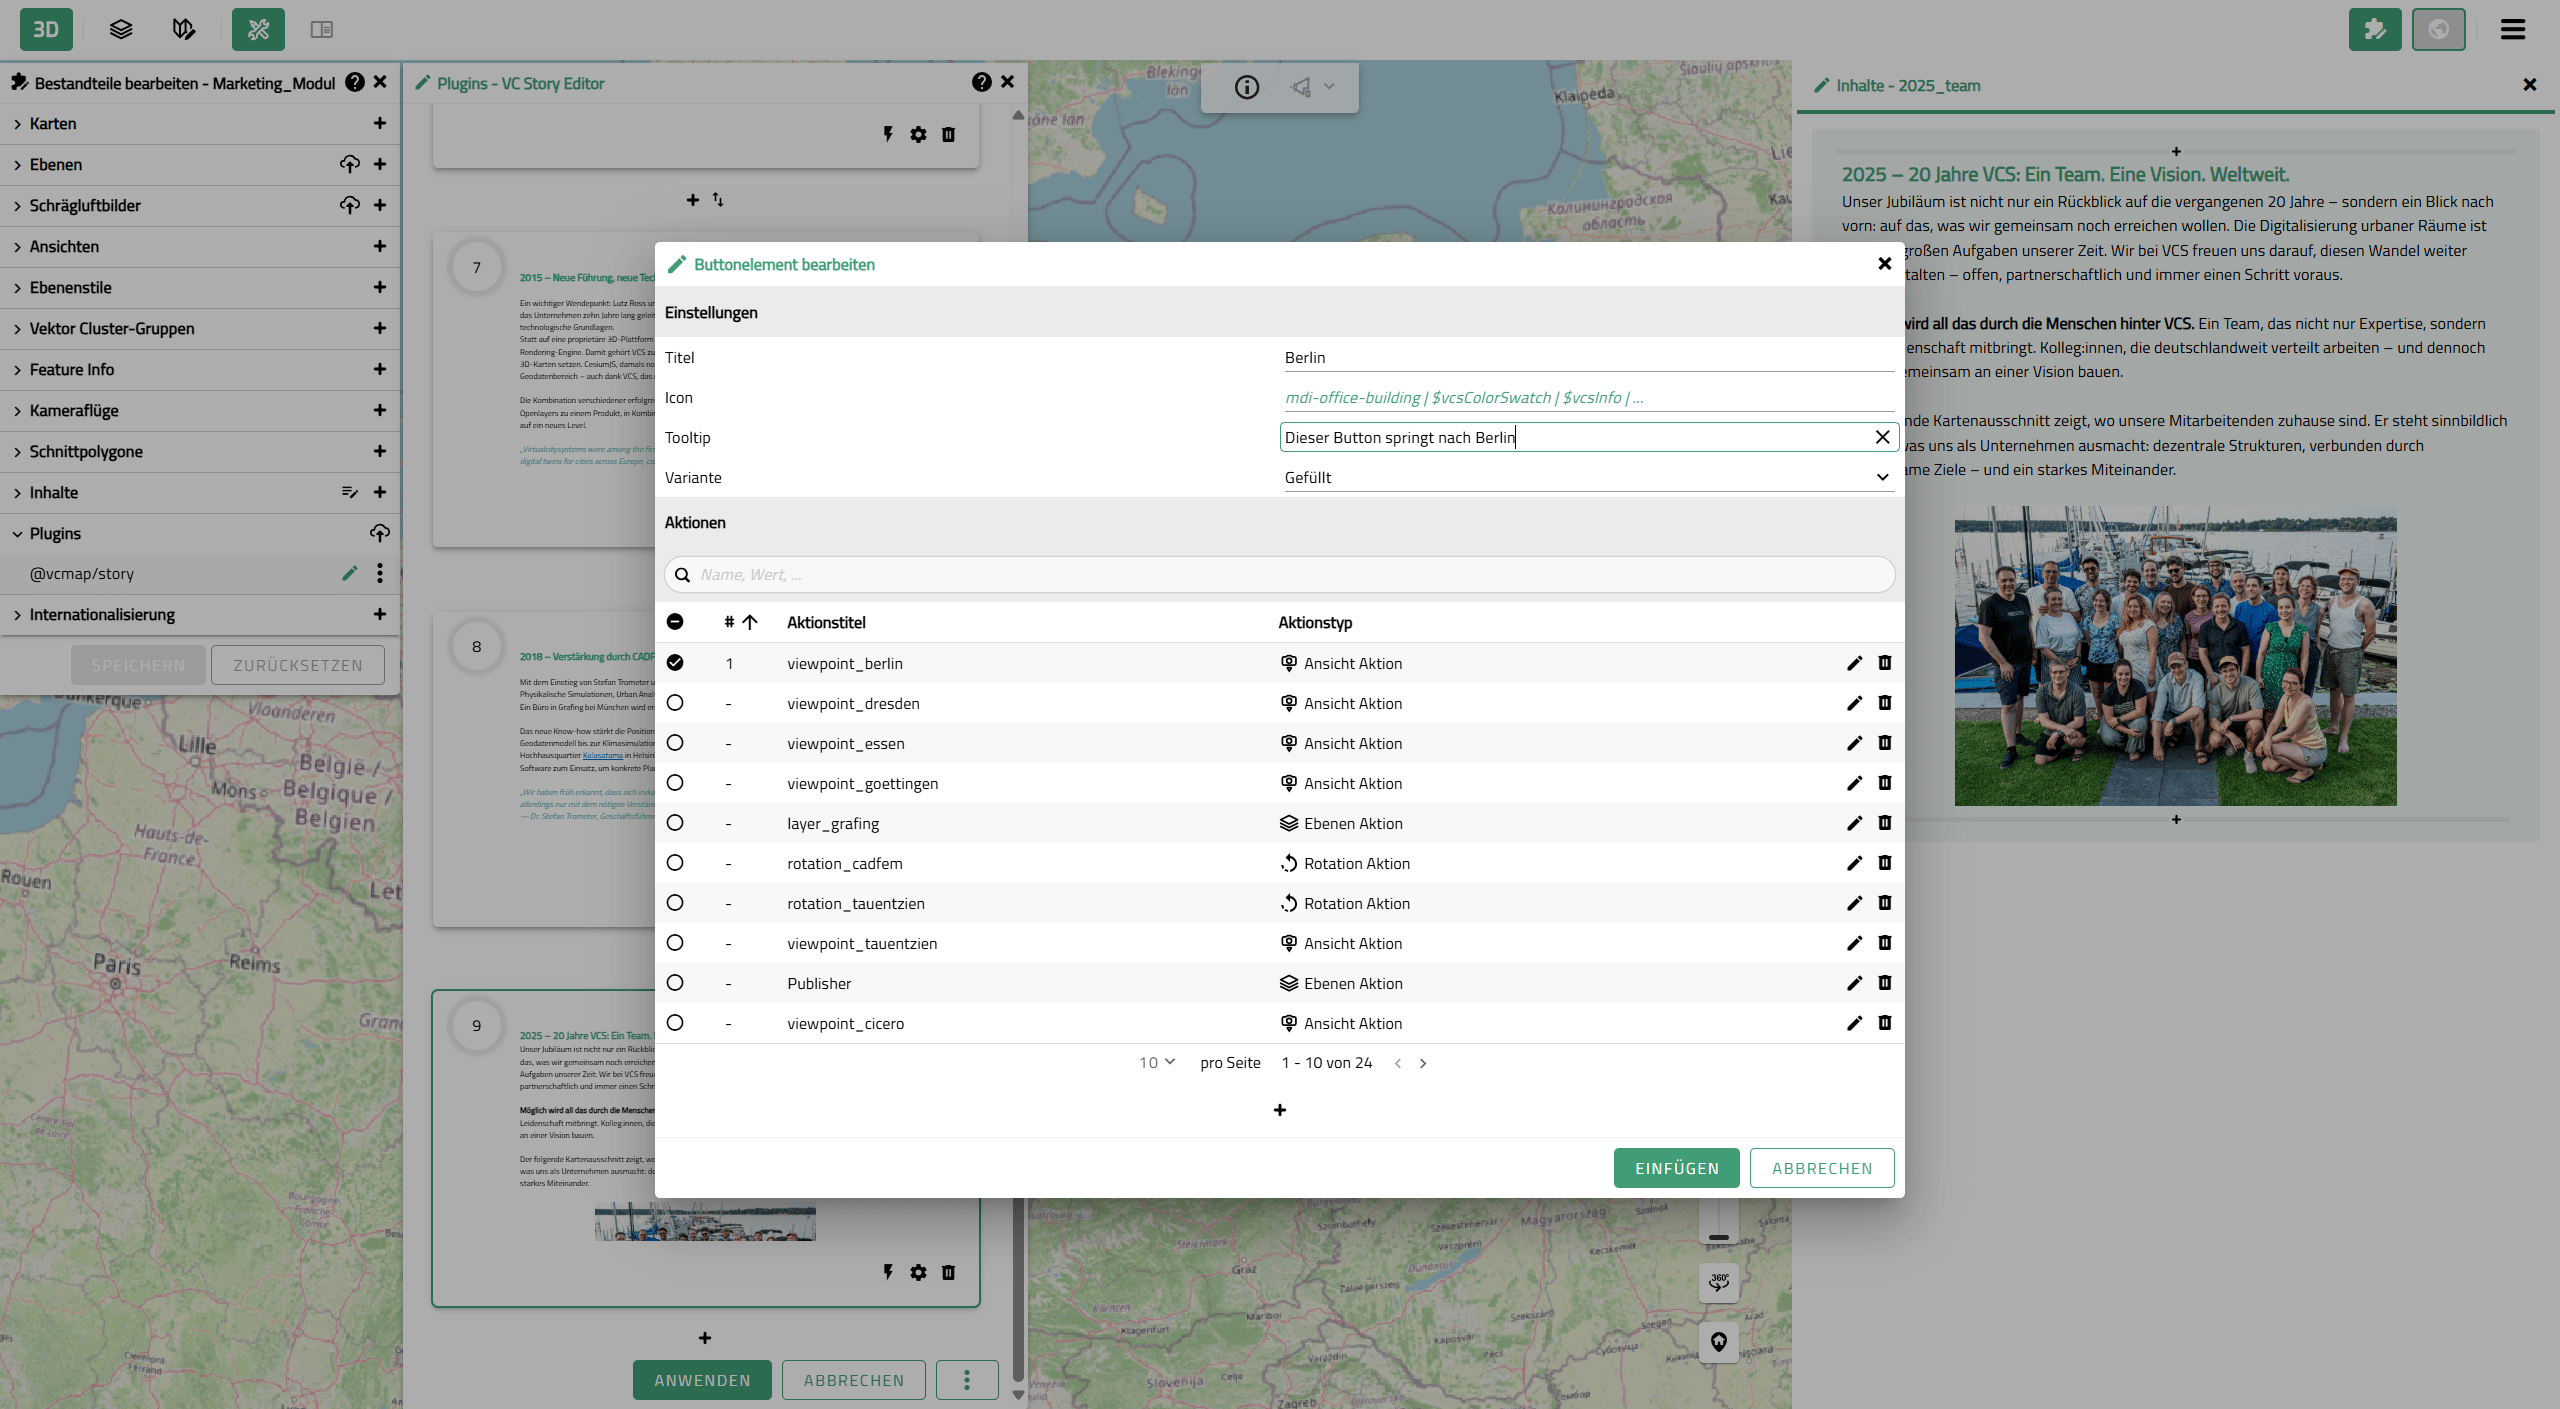
6. Creation of a button with a map action
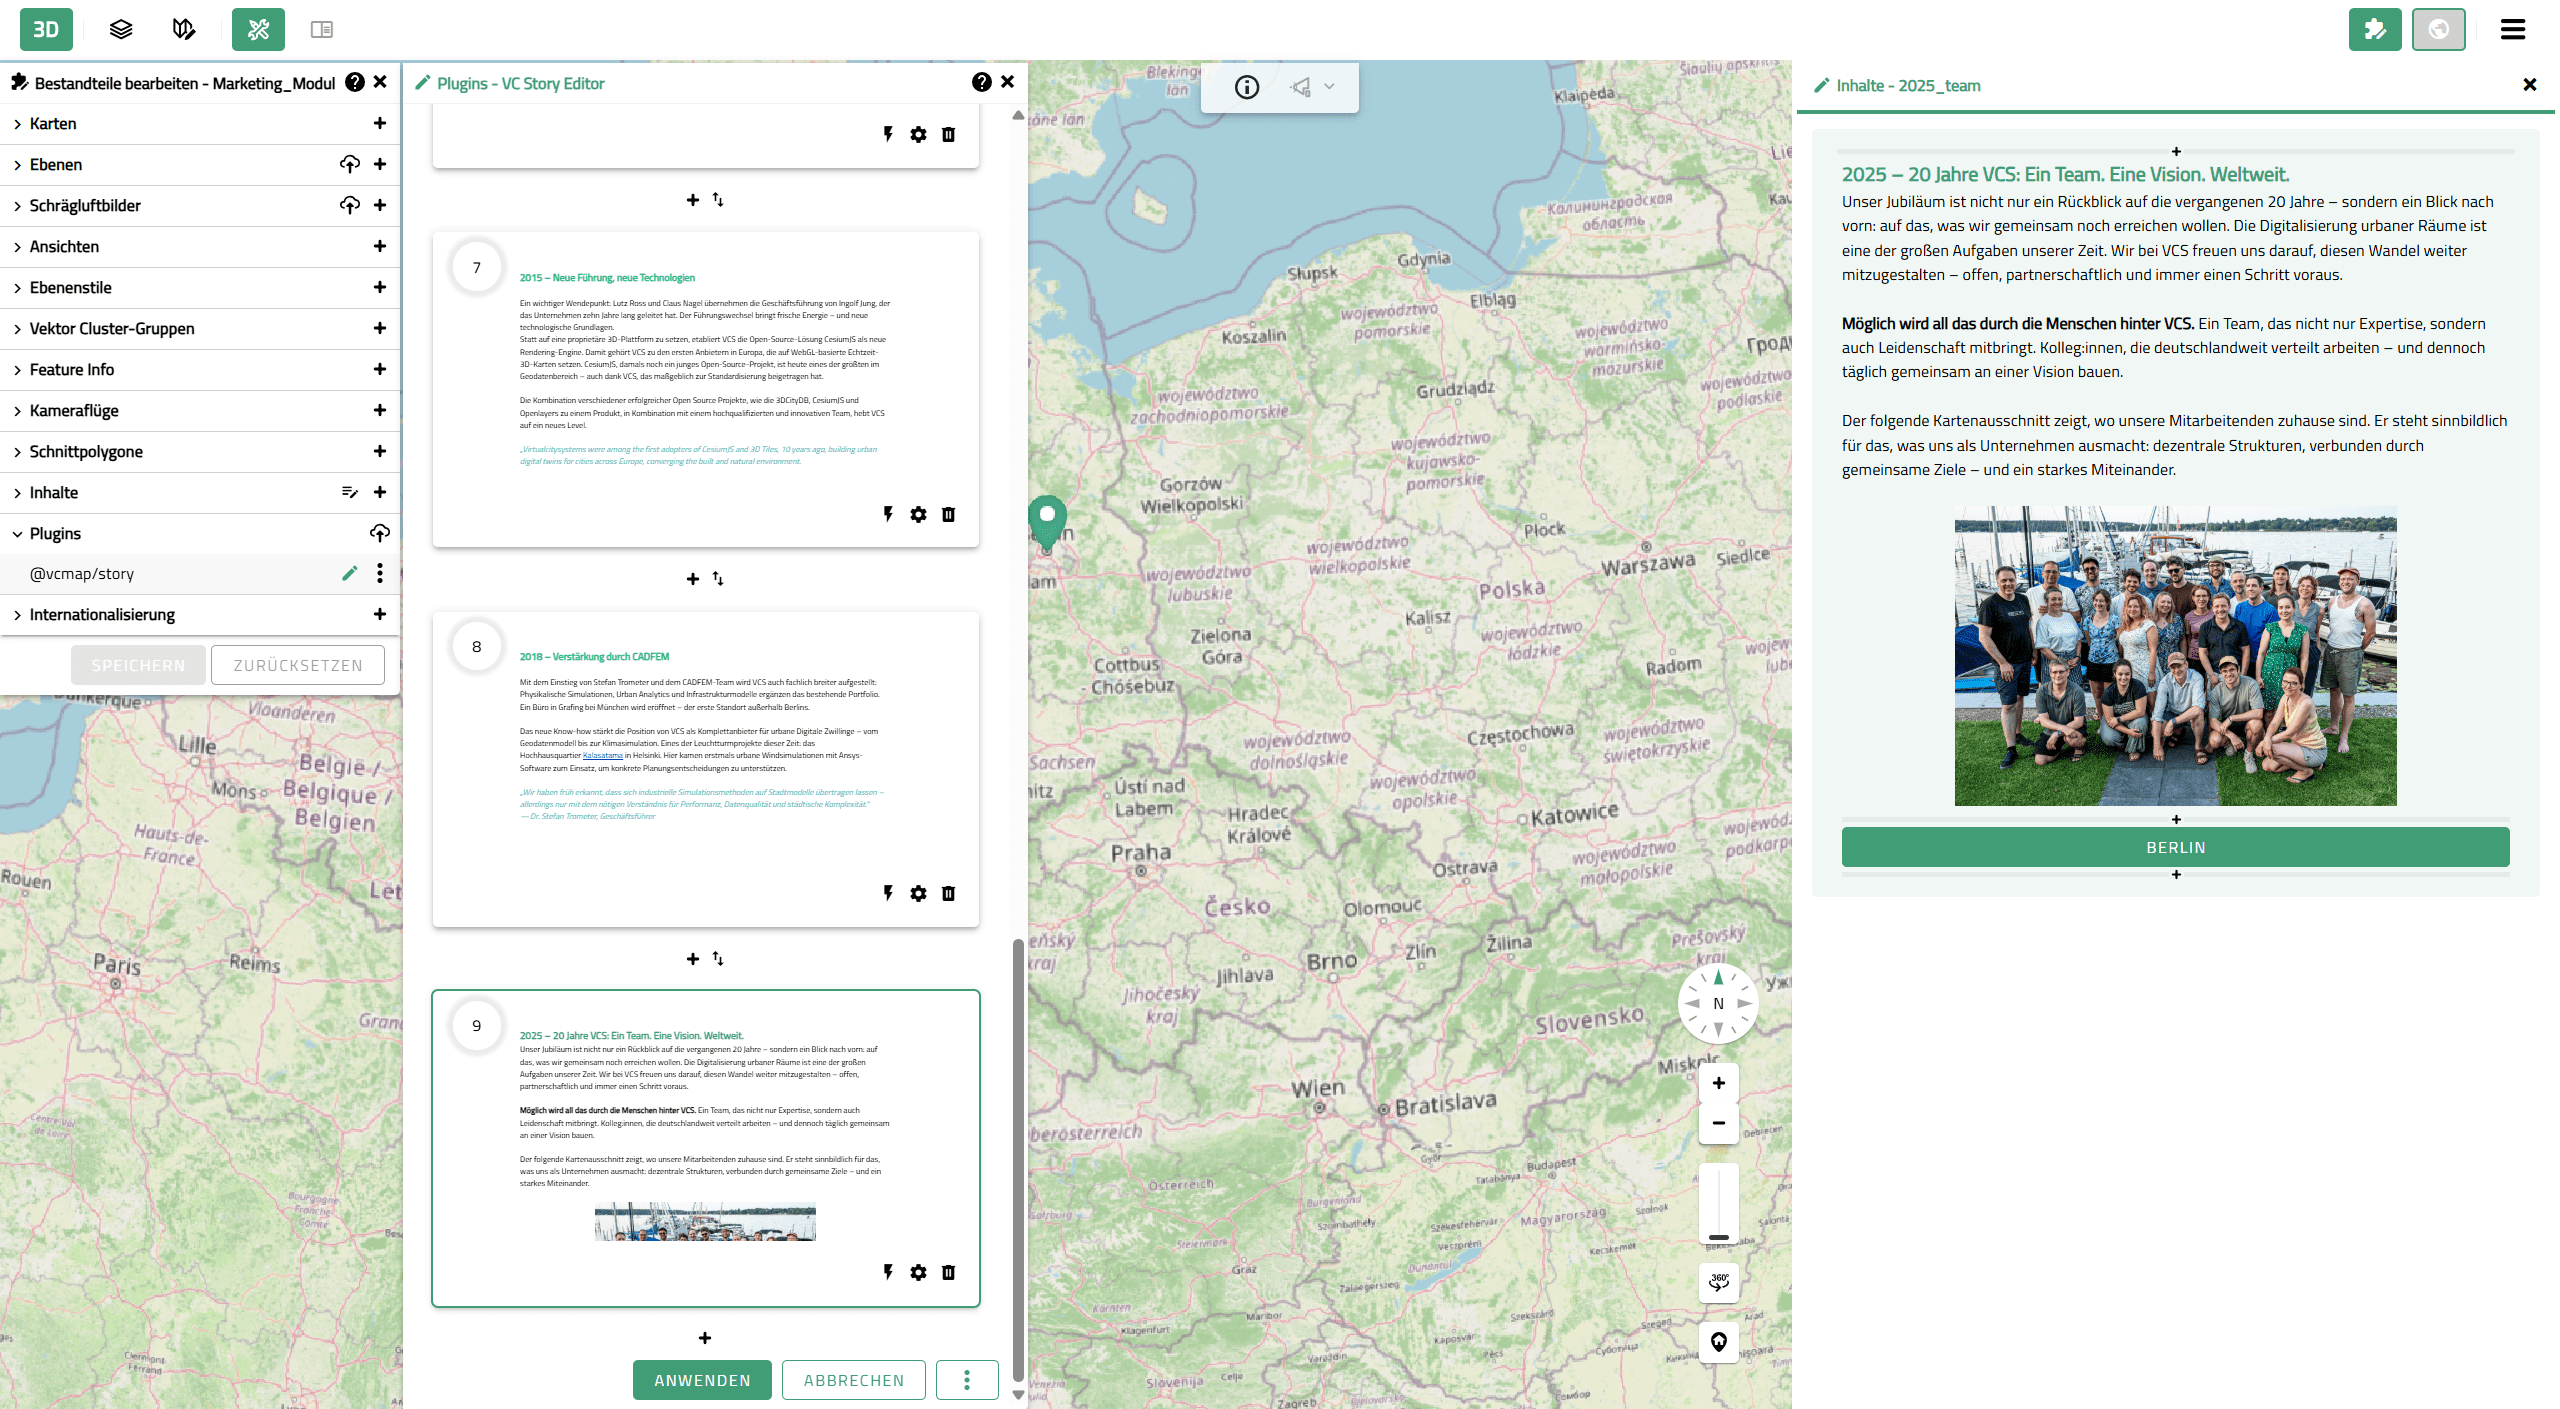
7. Display of a story section in scroll mode
Functions and Features of VC Story
VC Story extends map applications with a structured, interactive presentation layer:
Visualization & Interaction
- Easy and intuitive handling via a graphical user interface
- Fast creation without programming skills
Interaction & map control
- Linking content with layers, viewpoints, and other map functions
- Automatic synchronization of the map and the story
Delivery
- Creation in VC Publisher
- Integration of VC Story into VC Map and publication via VC Publisher
Benefits for Users
Geospatial data and project content can be communicated clearly and in a structured way using VC Story:
- Complex content is clearly structured and presented in a coherent way
- Geographic information and additional content are seamlessly combined
- Users are guided step by step through relevant content
- Content can be flexibly tailored to different target groups
Typical Use Cases include
- Urban development projects
- Focus topics, such as city maps tailored to specific target groups
- Virtual city tours
- Environmental and climate data
- Building and infrastructure planning
- Internal project communication
Examples (in German)
VC Stories are already used by customers in a wide range of projects—from municipal applications to specialized professional use cases. The following examples illustrate a selection of existing applications:
- VC Story of the State Office for Geoinformation and Rural Development Baden‑Wuerttemberg: XPlanung in the Smart Villages project. Explore
- Digital Twin Wiesbaden: In the welcome pop-up that appears when opening the VC Map, you can choose between the “World Design Capital 2026” and the “KONSUM und ICH” tour. Try it now
- Digital Twin Bremen: Select the thematic map “Bremer Stadtmusikanten” in the topic map selection. Click “Start application” to begin and follow the Bremen Town Musicians on their journey through the city. Experience it now
- VC Story Bamberg: Learn more about Bamberg’s digital twin in our blog article and start your journey through time. Find out more
- Children’s City Map Grafing: Explore Grafing from a child’s perspective. Get started
- 20 Years of Virtual City Systems Anniversary Story: Discover how ideas became solutions. Get to know us
VC Story as a Service
In addition to creating VC Stories independently using the VC Story Editor, they can also be delivered as a service. We support you in preparing your content and implementing the story application – feel free to get in touch with us.
Integration & Framework conditions
- Creation and use within VC Publisher as the central environment for configuration, management, and publication
- Integration into the App Configurator for direct use within VC Map
- No separate API – usage exclusively within the VC Publisher infrastructure
- Use of existing VC Map content and functions such as layers, viewpoints, and plugins
VC Story in Context of the VC Suite
The VC Story is an Upgrade within VC Map and enables the structured presentation, contextualization, and communication of content in the digital city model. Creation, maintenance, and publication of story content are carried out via VC Publisher.
VC Map
Display stories in the digital city model, position them spatially, and analyze them in context.
VC Publisher
Create, structure, and prepare story content for publication in VC Map.
Frequently asked questions about VC Story
What is the difference between VC Story and Guided Tour?
The Guided Tour supports onboarding within VC Map. VC Story, by contrast, is used for the domain-specific presentation of content and can be freely configured.
How are VC Stories created?
VC Stories are created using the VC Story Editor in VC Publisher or can be implemented as a service by Virtual City Systems.
Do I need programming skills?
No. Creation with the VC Story Editor is done via a graphical user interface and does not require any programming skills.
Can VC Stories also be created as a service?
Yes. VC Stories can also be implemented as a service by Virtual City Systems.
Is there an API?
No. VC Story does not provide a separate API and is used exclusively within the VC Publisher infrastructure.
Experiance VC Story live
Would you like to present spatial information in a clear and engaging way and communicate it in a targeted manner? We would be happy to show you how VC Story enables you to present content in its context and make it usable for different target groups.

“The added value of VC Story lies in making complex and abstract information understandable and tangible. Content, map, and sequence are seamlessly connected, making even complex projects accessible to different target groups.”