Digital Twin of the City of Arnsberg: How municipalities assess heavy rainfall, solar potential and wind energy in a comprehensible way
In the webinar on June 17, 2026, the City of Arnsberg and Virtual City Systems demonstrated how a Digital Twin can be used to present climate-related topics such as heavy rainfall, solar energy, and wind energy in a clear and understandable way.
The focus was on practical questions: How can risks be visualized? How can potentials be assessed? And how can complex information be communicated clearly? Yvonne Kaiser, Smart City Project Manager at the City of Arnsberg, guided the audience through the applications. Henry Farr, Head of Sales at Virtual City Systems, provided additional context on data integration and analysis.
Digital Twin of the City of Arnsberg: Part of the climate strategy
In Arnsberg, the Digital Twin is closely linked to the city’s Smart City strategy and its climate goals.
“All applications within the Digital Twin focus on sustainability and climate protection.” – Yvonne Kaiser, Smart City Project Manager, City of Arnsberg
The Urban Digital Twin serves as a shared foundation to combine different topics within a spatial context.
Visualizing wind turbines in context
Another use case presented was the visualization of planned wind turbines. Yvonne Kaiser showed how these turbines can be integrated into the city model at true scale. In addition, visibility analyses were used to determine from which locations turbines would actually be visible.
“This helps to represent wind turbines realistically within their spatial context.” – Yvonne Kaiser, Smart City Project Manager, City of Arnsberg
The webinar highlighted that wind turbine projects are often discussed in the context of public perception. Yvonne Kaiser explained that such projects had previously been evaluated based on photomontages that did not accurately reflect their real spatial impact.
The Digital Twin provides a more realistic perspective: turbines can be placed within the model and viewed from specific viewpoints. This makes it possible to understand how planned wind turbines will actually appear in the urban landscape and which areas are affected.
As a result, existing representations can be better assessed, and the impacts of planned installations can be evaluated within their spatial context.
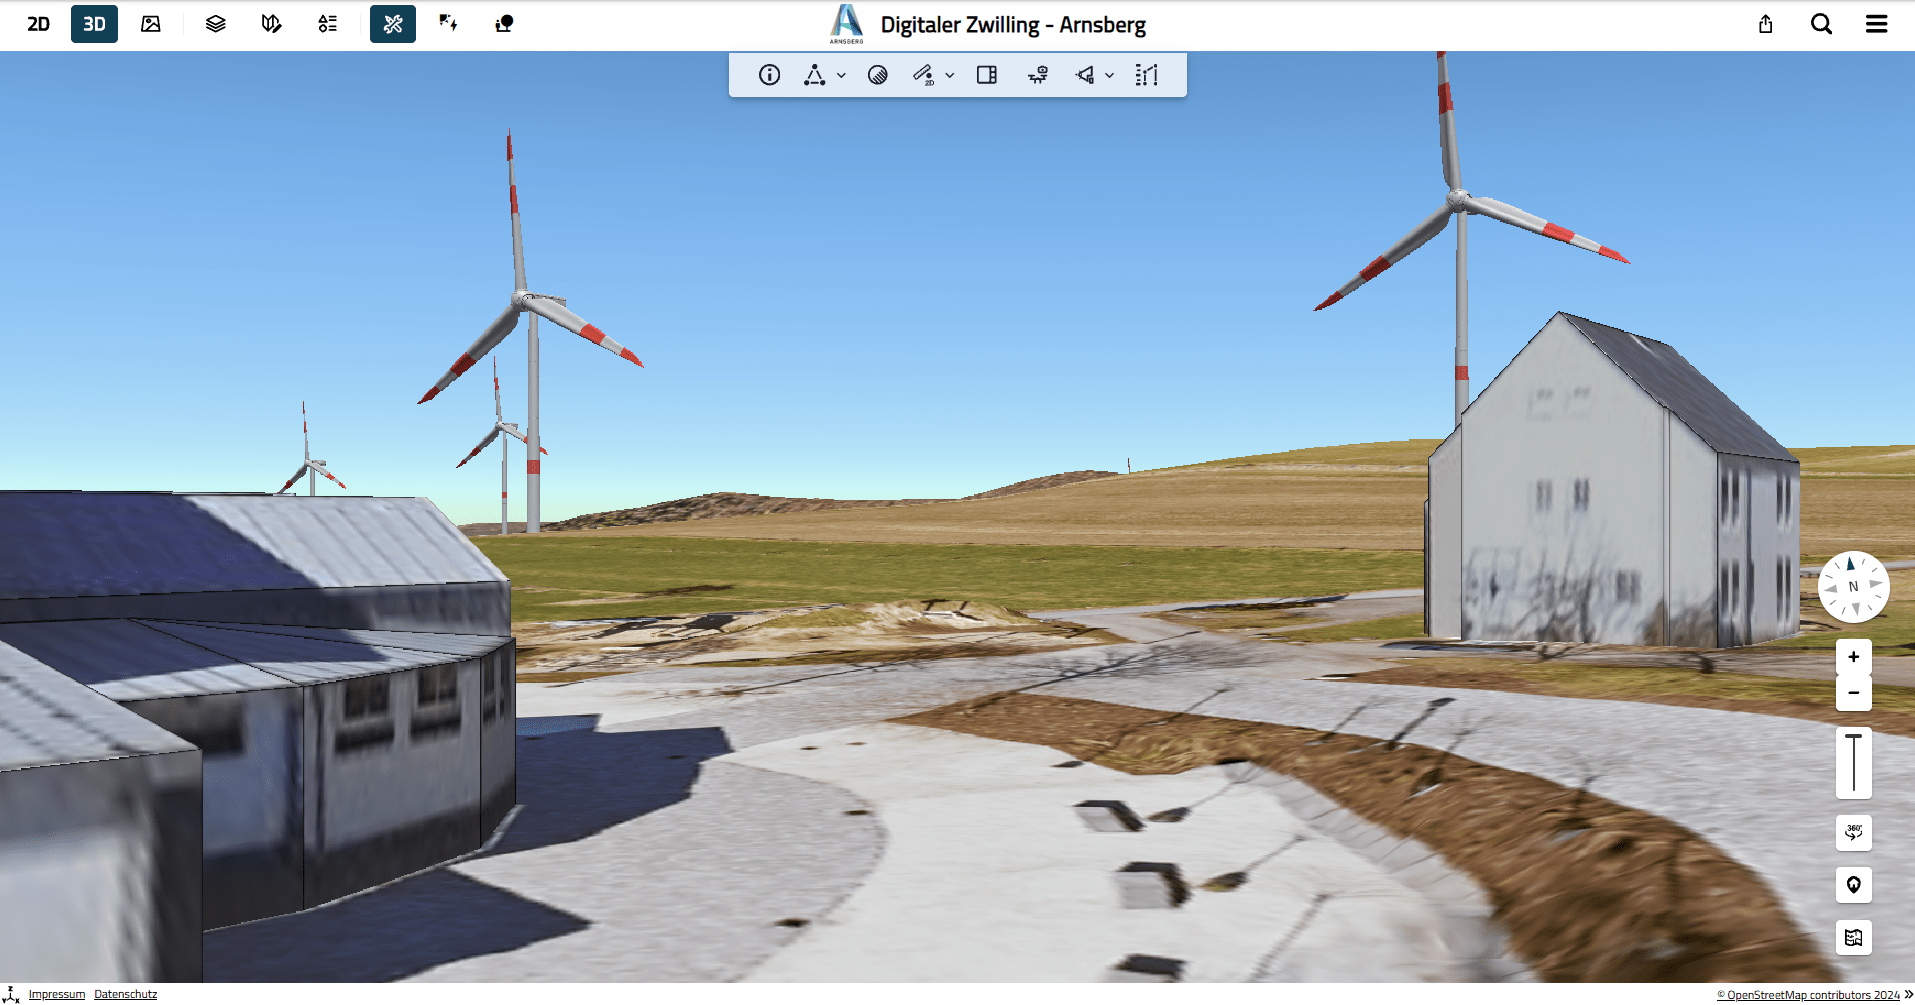
Figure: Visualization of wind turbines in the Digital Twin – realistic assessment of height, location and visual impact in the surrounding area.
Heavy rainfall and flood scenarios in a spatial context
At the beginning, Yvonne Kaiser demonstrated how flood scenarios can be visualized within the Digital Twin. Different scenarios show which areas could be affected. The key advantage is the direct connection to a specific location:
“Citizens can understand how, for example, a flood event would affect their immediate surroundings.” – Yvonne Kaiser, Smart City Project Manager, City of Arnsberg
In a city like Arnsberg, where the Ruhr River runs through the urban area, this creates a clear understanding of potential risks and impacts.
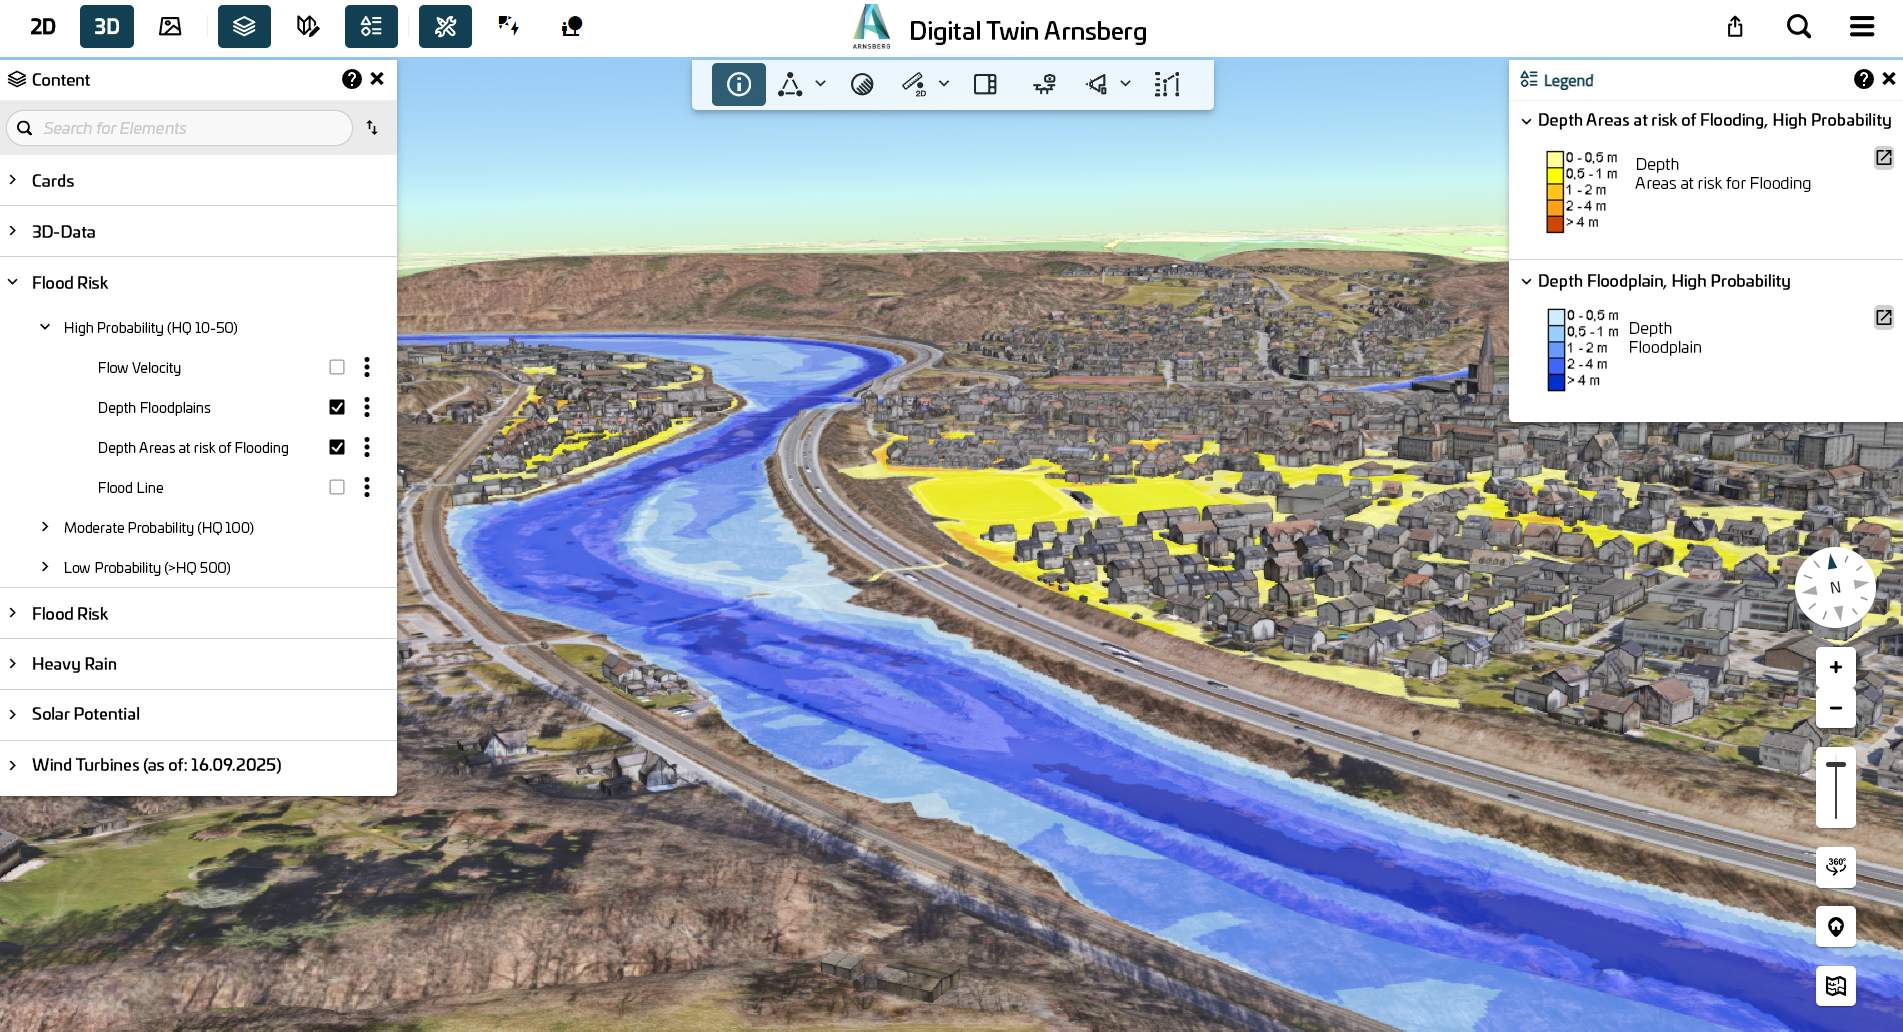
Figure: Flood and heavy rainfall simulation in the Digital Twin – visualization of potentially flooded areas along the Ruhr.
Assessing solar potential at building level
Yvonne Kaiser then demonstrated the solar potential analysis directly on a building. The evaluation is carried out on individual surfaces, making it possible to identify which parts of a building are particularly suitable.
“The analysis can be broken down to individual surfaces of a building.” – Yvonne Kaiser, Smart City Project Manager, City of Arnsberg
She also introduced the integrated calculator of the VC Solar App. It allows an initial assessment of usage and cost-effectiveness for specific areas. Solar suitability of building and open spaces can be calculated directly within the model, with adjustable parameters such as consumption, usage, or costs. Based on this, potential yields, CO₂ savings, and economic effects can be identified.
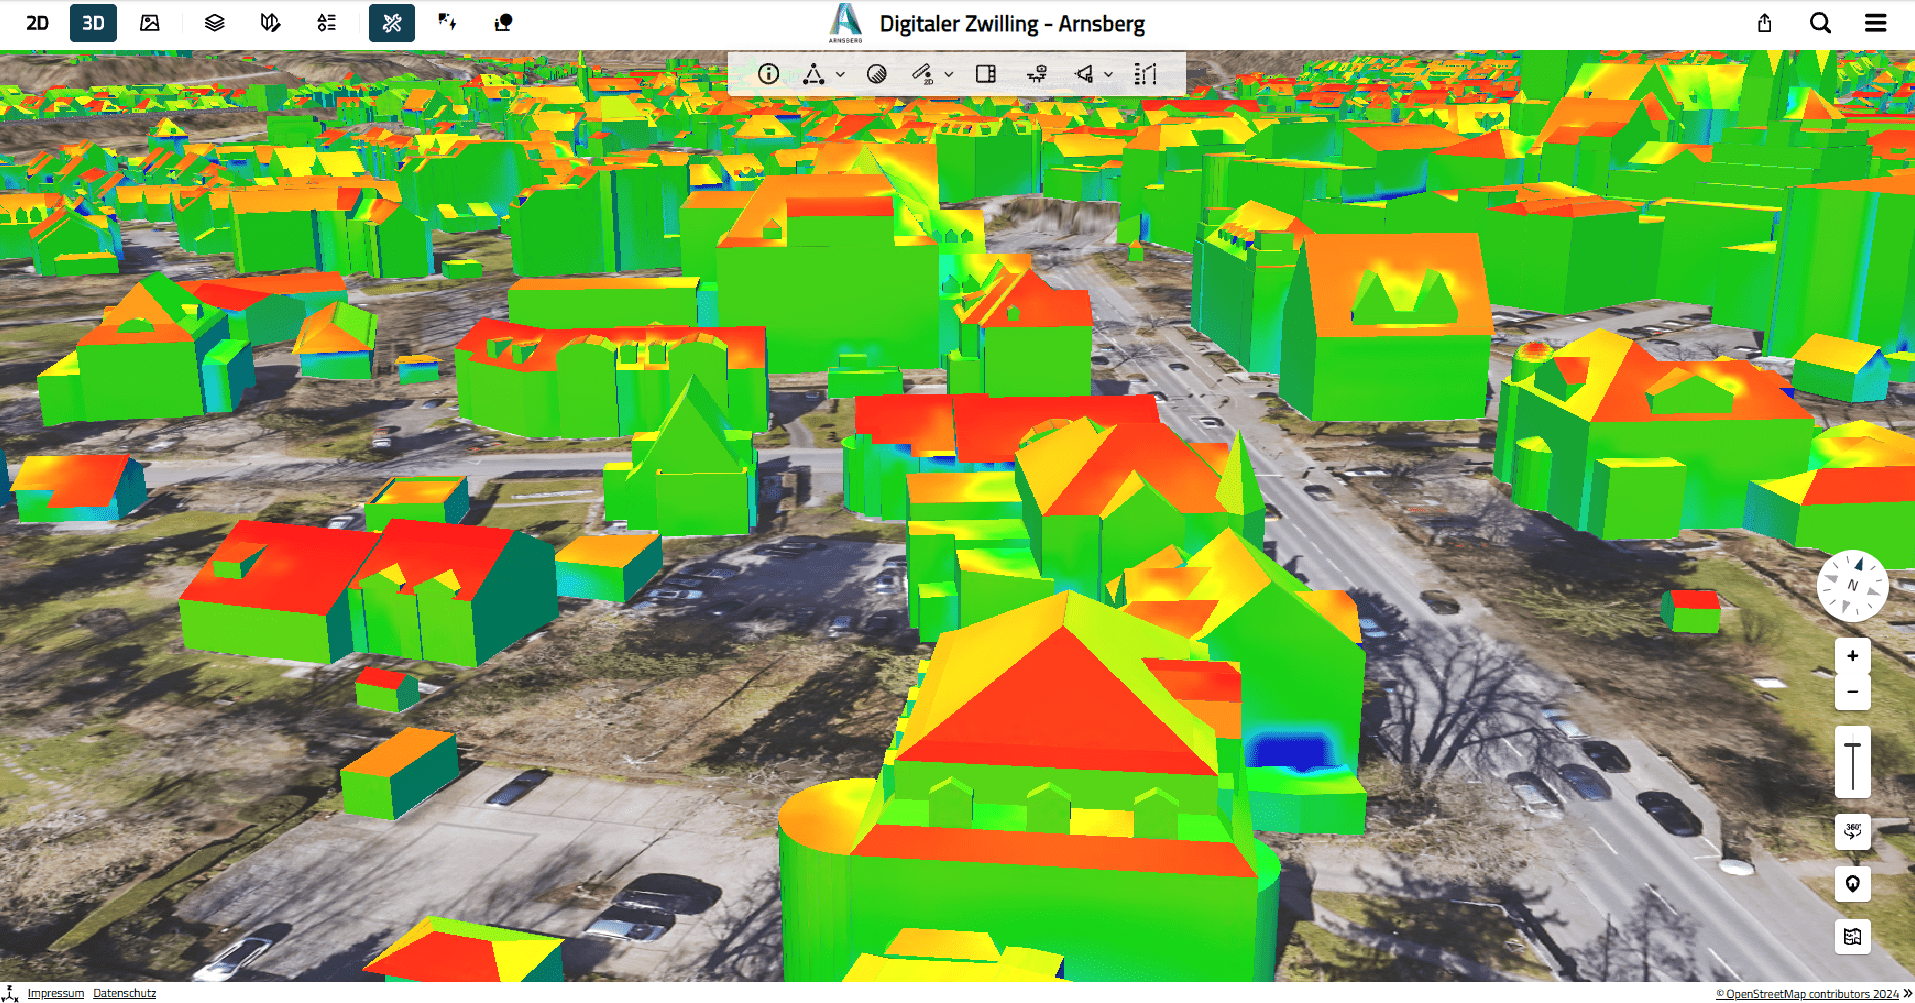
Figure: Solar potential analysis in the 3D model – assessment of the suitability of building surfaces based on solar radiation and shading.
How the applications come together in the Urban Digital Twin
Henry Farr then built on these examples and provided a technical perspective. He described the Urban Digital Twin as the integration of different types of geospatial data – from terrain and buildings to domain-specific datasets. The applications shown in the webinar result from this combination: data is linked, analyzed, and then made accessible through intuitive visualization.
Understanding simulation in context
Another topic addressed in the webinar was the meaning of “simulation”. Many of the displayed results – such as flood and heavy rainfall scenarios – are based on pre-calculated data that is visualized within the Digital Twin. As Henry Farr explained:
“Simulation is always a matter of perspective.” – Henry Farr, Head of Sales, Virtual City Systems
Ultimately, the key factor is not the complexity of the underlying models, but how the results are communicated and understood.
Q&A: Questions from the webinar
Partially. In many cases, pre-calculated scenarios are visualized.
No. The information is represented via surfaces and color coding.
Not as a standard feature, but they can be included in specific projects or simulations.
The results were described as being close to real-world calculations.
It helps to make planned developments understandable and easier to assess.
Conclusion: Clarity as a key benefit
The Digital Twin of the City of Arnsberg demonstrates how complex climate-related topics can be translated into a clear spatial context. The value lies not only in the data itself, but in how it is presented: relationships become visible, assessments become understandable, and decisions can be better contextualized.
This makes the Urban Digital Twin a valuable tool for both planning and communication.
Would you like to assess which use cases are relevant for your Digital Twin or how existing data can be utilized effectively? Feel free to contact us – we will support you in developing your Urban Digital Twin in a structured and practical way.
“Simulation is always a matter of perspective.”