Communicating Geospatial Data effectively: Why Maps alone are often not enough
In the VC Story webinar on July 8, 2026, VCS developers Roland Ruhdorfer and Tobias Krauth demonstrated how map stories help communicate spatial information in a clear and engaging way — and how the new editor makes creating them significantly easier.
Urban development projects, infrastructure measures, and climate adaptation initiatives have one thing in common: they are all based on geospatial data. Maps make this information visible and provide orientation.
For many topics, however, it is helpful to place the map into a broader context. Providing thematic background and guiding viewers through a coherent narrative helps audiences better understand complex issues, proposed measures, and planning processes.
This was the focus of our VC Story webinar. Roland Ruhdorfer and Tobias Krauth, both developers at VCS, demonstrated through a range of examples how spatial information can be prepared and communicated in a clear and engaging way.
Map Stories help audiences understand spatial information
Map stories combine maps with text, images, and interactive elements. This helps place information into a meaningful context, making complex topics easier to understand and follow. Whether for urban development, infrastructure planning, environmental and climate data, tourism, or other municipality-specific applications, map stories present information in a visual and engaging way.
Examples of how our customers use map stories, as well as further information, can be found on the VC Story product page.
Creating Map stories is easier with the new VC Story Editor
VC Story itself is not new. The focus of the webinar was the new editor, which makes creating map stories significantly easier and faster.
“Our goal was to simplify and accelerate the creation process, making it much easier for users to build their own stories,” explained Roland Ruhdorfer.
With the new VC Story Editor, content can be created directly within a graphical user interface. Text, images, and interactive elements can be arranged into individual sections and linked to map functions at the same time. The editor follows an intuitive drag-and-drop approach and is designed around familiar editing concepts, allowing users to create map stories without any programming knowledge.
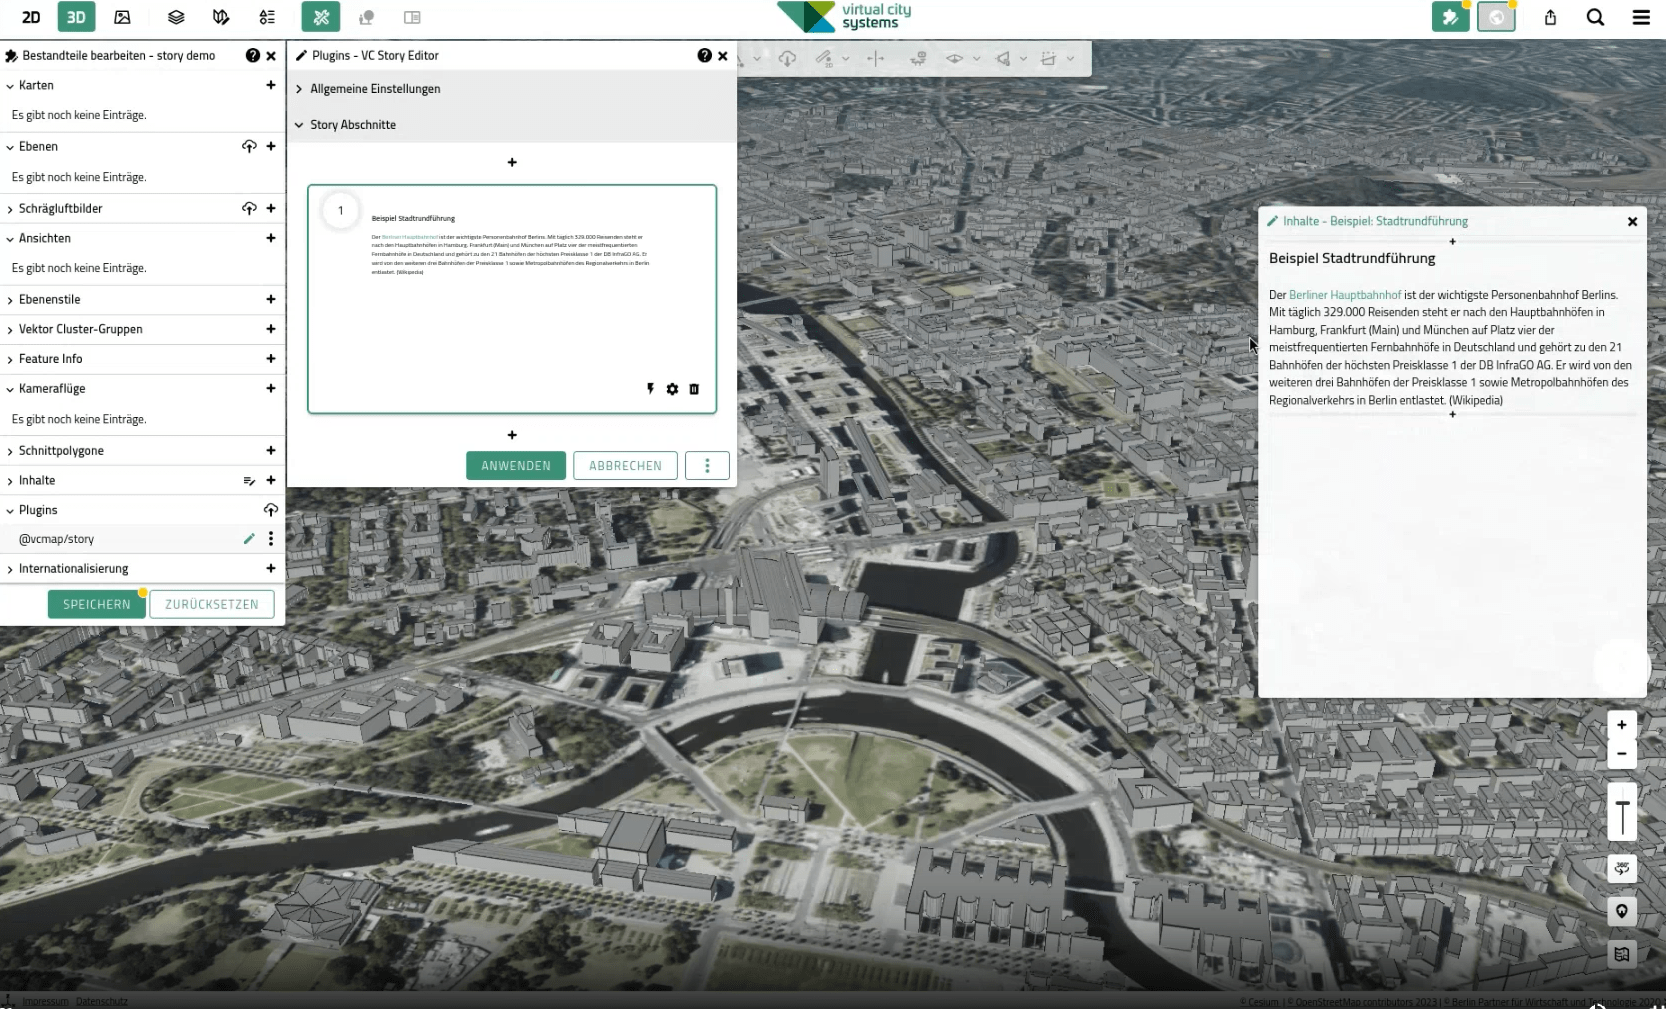
WYSIWYG: Create Map Stories Without Programming Skills
Questions from the audience
The Q&A session focused on practical aspects of using VC Story. Participants discussed topics such as the use of multiple stories within a single map application and the integration of oblique imagery and panoramic views.
Attendees also asked about support for additional media types, including video and audio content. The discussion highlighted that the requirements for communicating geospatial information continue to evolve and are becoming increasingly diverse.
From historical aerial photos to planning visualizations
In the practical part of the webinar, the presenters demonstrated the wide range of ways map stories can be used. Examples included comparing historical aerial imagery, visualizing planning scenarios, and integrating shadow analyses. Participants also saw how users can be guided through different map views and how content can be directly linked to actions and interactions within the map.
These examples illustrated how map stories can transform geospatial data into engaging, easy-to-understand narratives tailored to different audiences and use cases.
(The webinar recording is available in German. Registration is required.)
The webinar featured the following sample stories and demonstrated a variety of content elements:
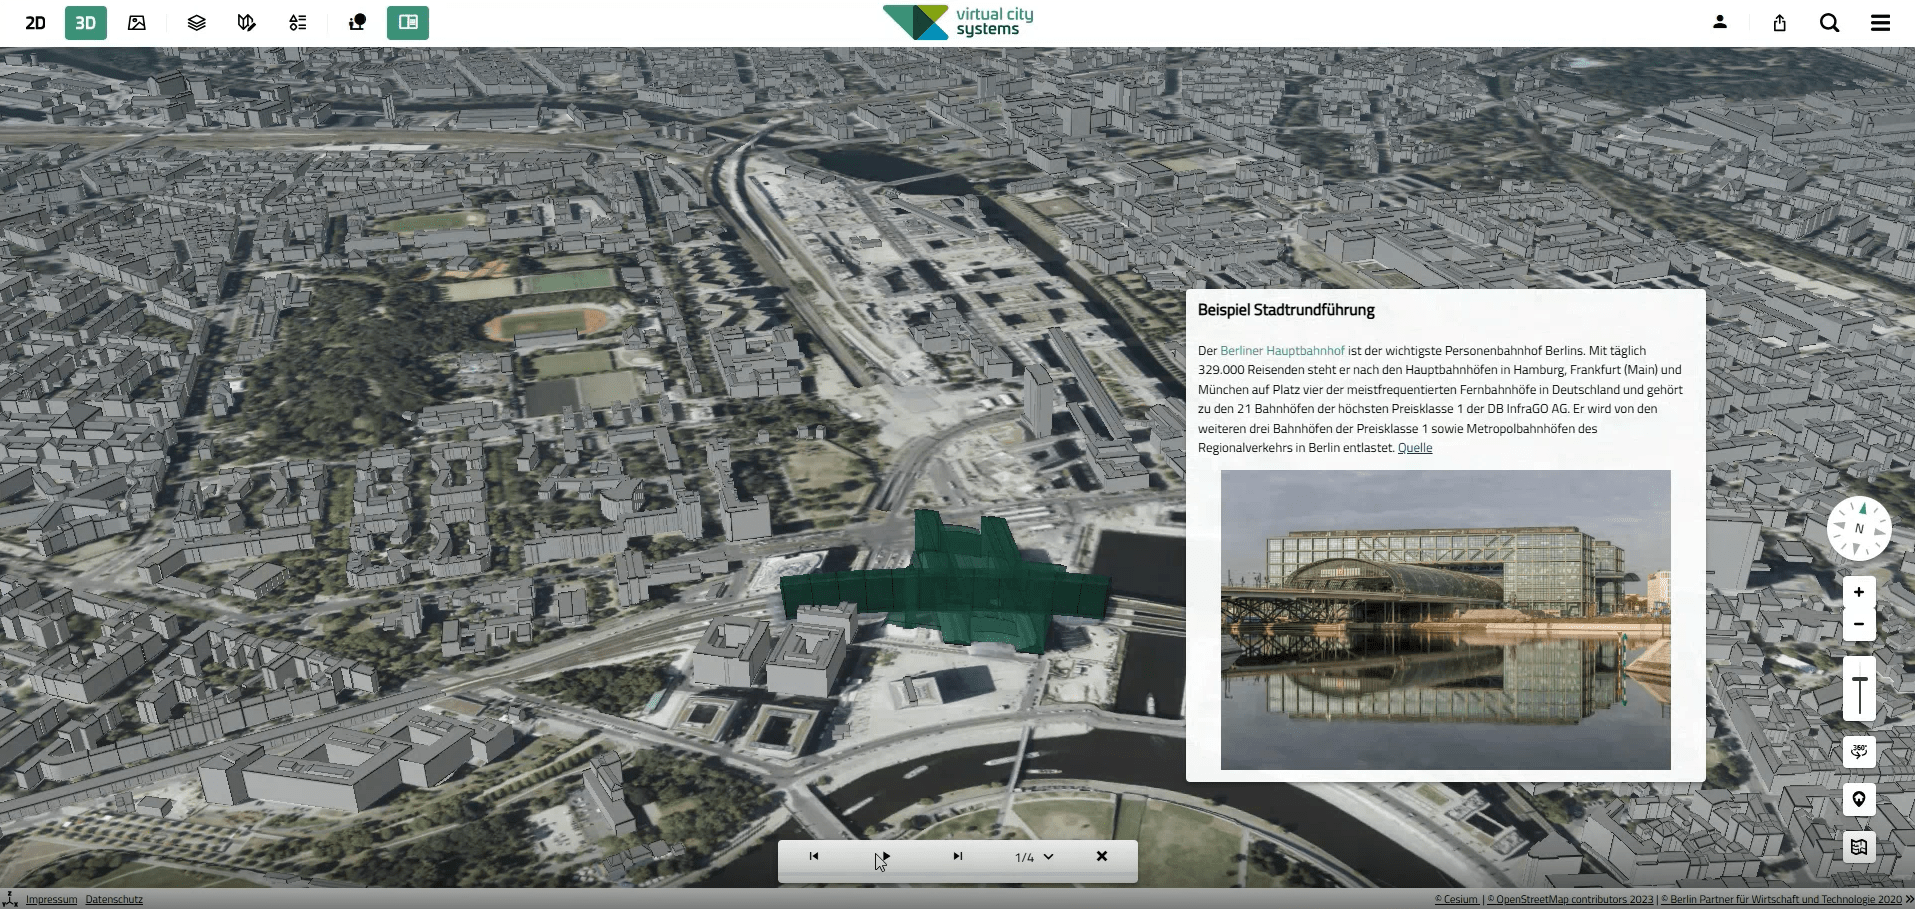
Example city tour: Berlin Central Station. Highlighted buildings and information panels provide additional context through images and background information.
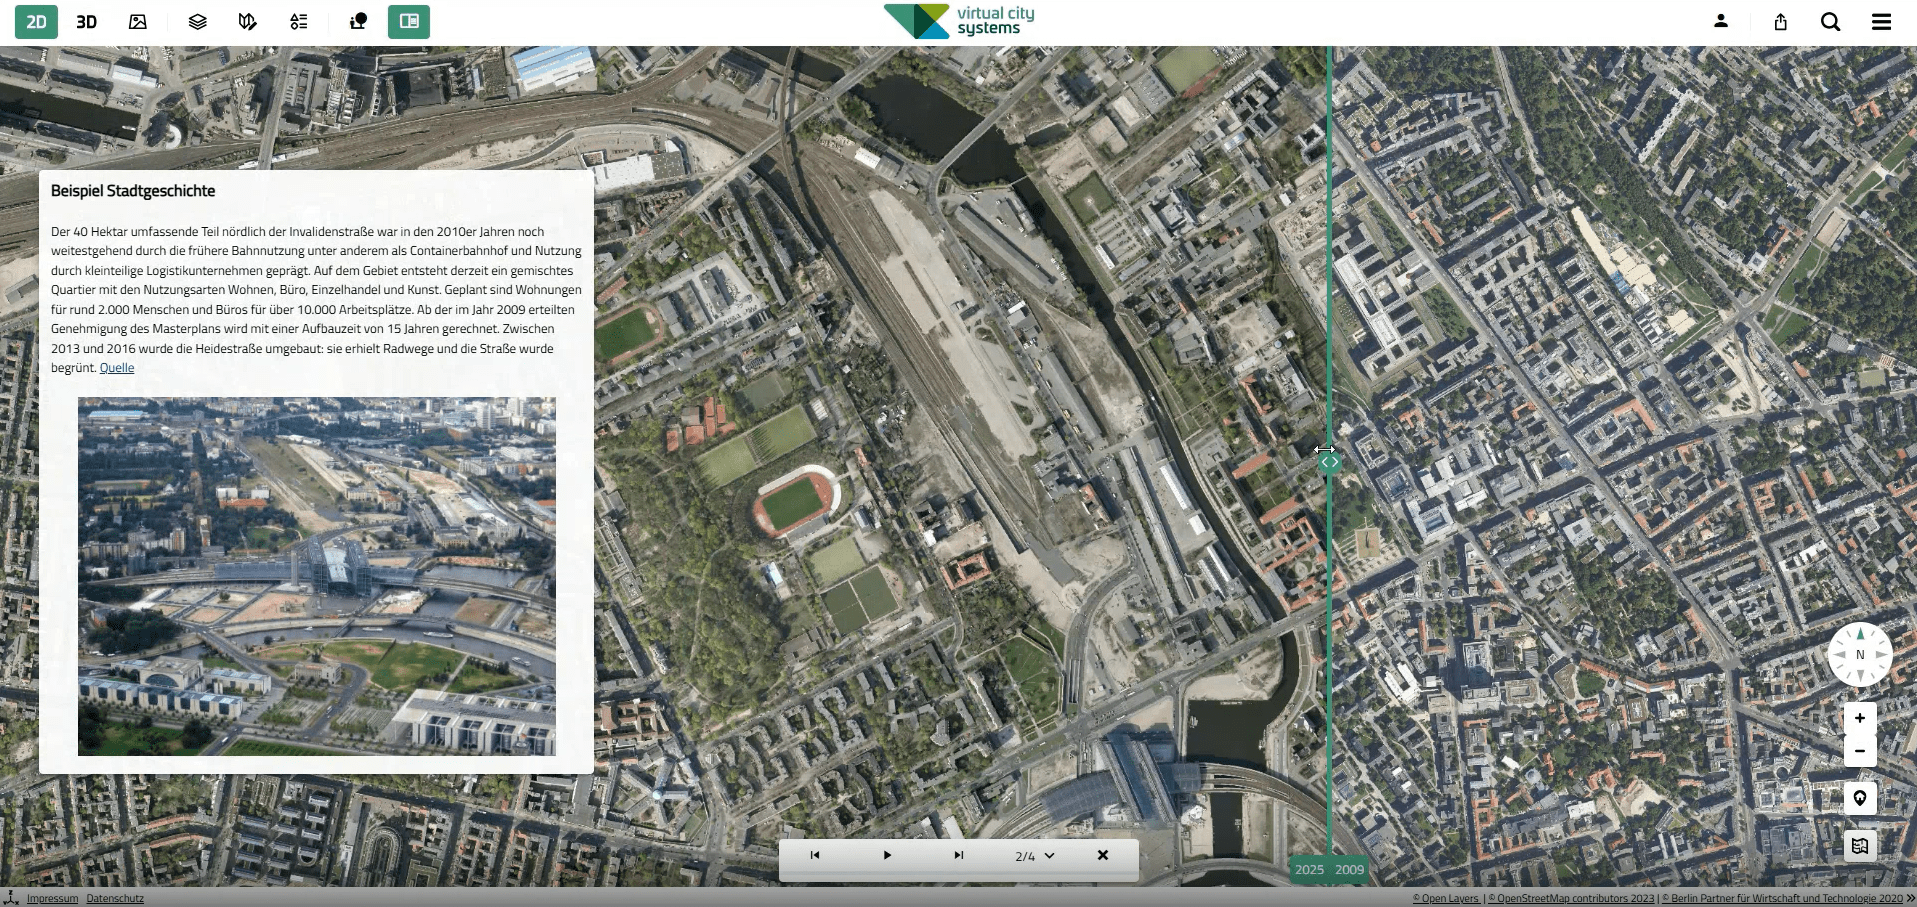
Bring local history to life. Here: a comparison of aerial imagery from 2009 and 2025.
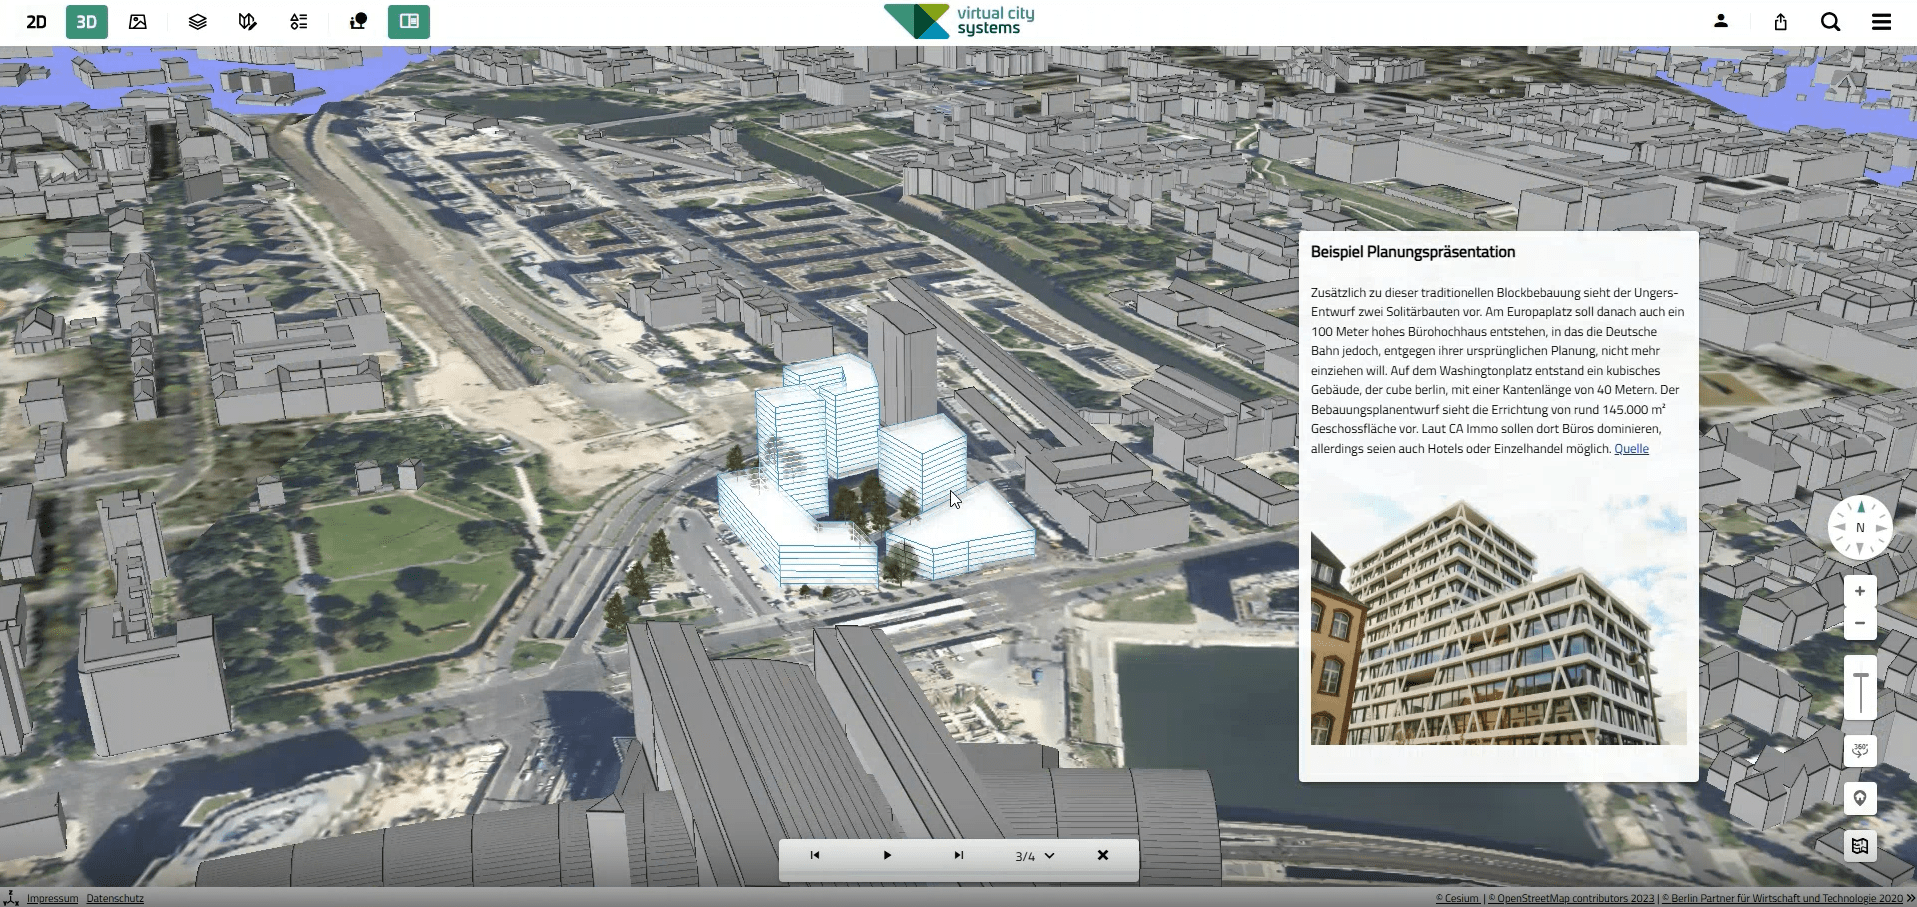
Urban planning visualization with additional building information. Fictional example.
Conclusion: The growing importance of clear communication
Today, geospatial data plays a key role in a wide range of projects, supporting both decision-making and communication. At the same time, expectations are growing for information to be presented in ways that are clear, engaging, and easy to understand.
Map stories help address this challenge by turning complex spatial information into structured narratives that guide audiences step by step through a topic. The examples presented during the webinar demonstrated how maps, content, and interactive elements can work together to make information more accessible and meaningful.
The webinar also showed how the new VC Story Editor significantly reduces the effort required to create map stories. By bringing content and map views together in a single editing environment, the editor enables users to build, update, and maintain stories more efficiently. As a result, information can be published faster, kept up to date more easily, and shared without additional development work.