Rostock: Building an independently operated and flexible geodata platform
How Rostock achieves flexibility and independence through the VC Suite and a consistently modular approach
Smart Perspectives for a Self-Determined Digitalization
How Rostock Rethought Its Geodata Infrastructure and Embarked on a Strategic Restart
With the transition to the modular VC Suite, the city administration reassessed its existing portals and desktop systems, laying the foundation for a new, open, and future-oriented platform.
Rostock deliberately took ownership of this transformation of its geodata infrastructure.
The VC Suite now forms a key component of the municipal geodata infrastructure: with its powerful tools and functionalities, it drives the city administration’s digital performance and integrates seamlessly into the existing architecture. Through its 3D environment, it supports administration, climate strategy, and public communication – opening up new opportunities for municipal innovation.
“We wanted a platform that we could operate independently, shape flexibly, and continue to develop with a futureproof perspective.”
A Comprehensive Approach from the Outset
We now rely on the full range of the VC Suite – from VC Warehouse and VC Publisher to VC Planner and even specialized applications we have co-developed. For us, the platform is far more than a GIS: it is a central building block for qualifying and providing data to support the digitalization processes of the city administration.
With VC Map, our medium-term goal is to replace additional portal solutions, integrate 2D and 3D environments, and fully replicate the functionality of several existing desktop GIS systems through WebGIS. Already, some desktop systems have been decommissioned. The introduction of the Panorama Viewer will further eliminate products – along with the need for installations, software maintenance on different devices, and user management overhead.
One example of our progress toward a true Digital Twin is the extension of the VC Solar App with an economic feasibility and CO2 savings calculator, which we developed jointly with VCS. This tool has become an integral part of our climate strategy: it enables decisions to be made on an objective basis and allows the suitability of properties to be evaluated quickly and transparently – independent of personal assessments.
Challenge: Breaking Free from Constraints – Embracing Openness and Self-Determination
Before introducing VC Map as a new platform module for managing and publishing 3D geodata, Rostock already had a functioning 3D portal. Technically solid, but its rigidity was hardly compatible with our aspiration for flexibility and adaptability. Day-to-day use within the administration was cumbersome, and genuine innovation failed to materialize.
Our Regional Geoinformation Systems division therefore deliberately sought a solution compatible with existing GIS systems, capable of representing our data with precision, and designed to simplify its use. The goal was to create new scope for action – with a system that is modularly expandable, application-driven, independently operable, and technologically future-proof.
During the selection phase, we subjected various products to a detailed technical evaluation. The VC Suite convinced us above all with its modular architecture and its extensive capabilities for processing, analyzing, and presenting geodata. Key factors included powerful data processing, the open-source code base, and the clearly documented, transparent implementation concept of VC Map.
Of particular importance to us was a system that could technically support municipal processes, be flexibly adapted to our needs, and enable us to pursue independent further development – without long-term dependence on external service providers.
“With the VC Suite, Rostock has consistently modularized its digital infrastructure for the Digital Twin, thereby creating new scope for innovation. It is a prime example of how municipal digitalization can be implemented with sovereignty, pragmatism, and strategic vision.”
Features We Actively Co-Develop
In transforming analog processes into fully digital workflows, the VC Suite serves as a central building block. Through powerful API interfaces, we orchestrate automated data pipelines that enrich and transform raw data in preprocessing workflows – for example, with the VC Publisher – and make it available almost in real time for other applications or directly within VC Map. VC Publisher and VC Map will also play a key role in upcoming transformation projects.
- One example is our tree cadastre, which is fully integrated into GDI.HRO and continuously extended with sensor data. For irrigation monitoring, we use watering probes whose measurements are visualized directly in VC Map. Looking ahead, we plan to link this live data with climate prediction models in order to develop algorithmically optimized Irrigation strategies.
For these use cases, we develop custom interfaces, scripts, and automations tailored precisely to our requirements. This results in practical, technically robust solutions that can be seamlessly integrated into everyday administrative workflows. - We are also advancing 3D development: building modelsare partly created with Blender and further enhanced using a CityJSON editor we developed ourselves – based on the open-source foundations of TU Delft.
- Panorama Viewer & AI: In a pilot project, we are analyzing traffic signs in 360-degree panoramas using AI. The Panorama Viewer is used to clearly display the results of our AI analyses. While the actual evaluation takes place in dedicated AI environments, the Panorama Viewer provides a quick and georeferenced view of the discrepancies detected by AI between reality and cadastral data. This allows anomalies to be checked efficiently without having to manually review all images.
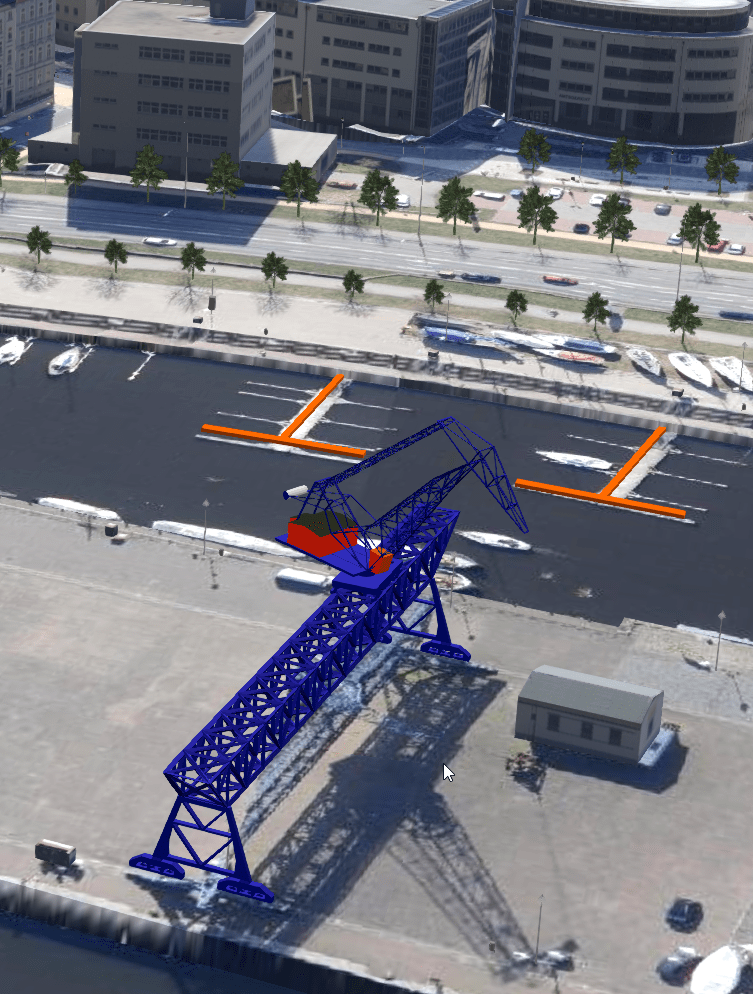
Figure: Bridge crane in Rostock’s city harbor.
VC Solar: A Tool for the City and Its Citizens
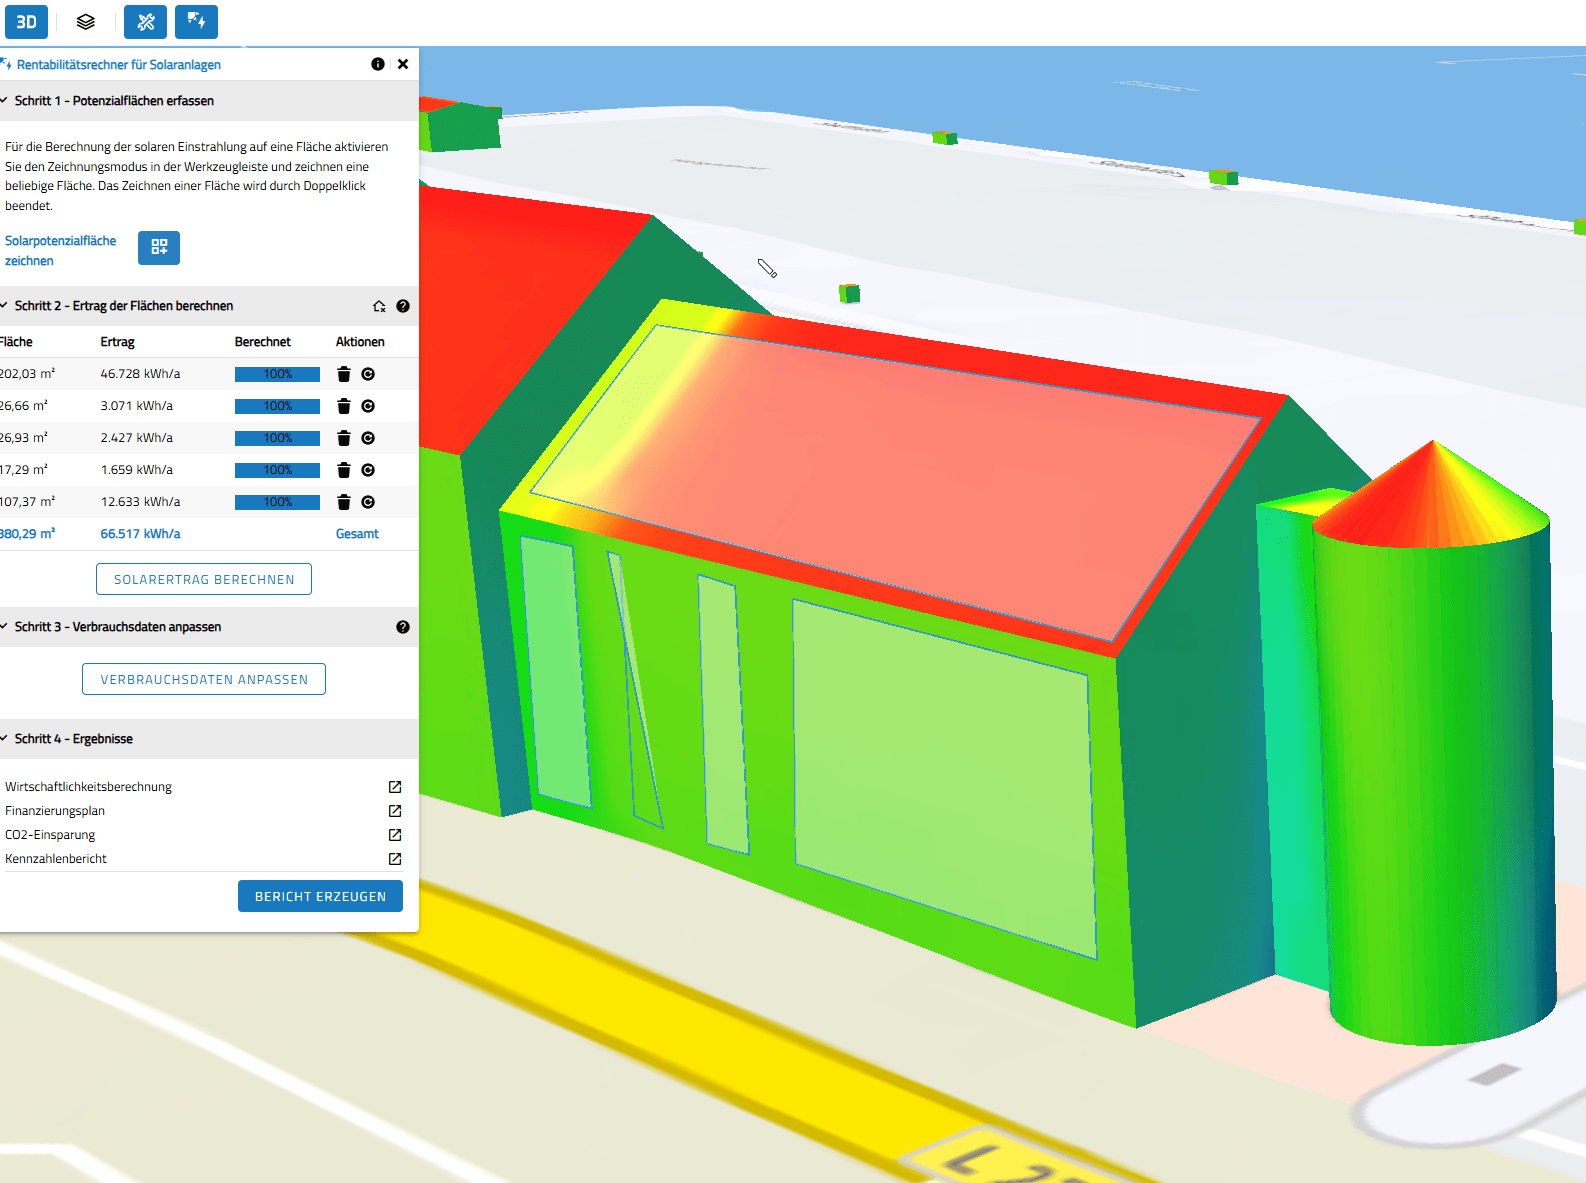
Figure: After selecting the solar potential area, the calculation of the system’s profitability can be initiated.
The initiative for the extension came from the Environmental Office, which requested functionality for assessing the economic feasibility and CO2 savings potential of solar installations. Since we were already using the VC Solar plugin to determine solar potential across any 3D objects and did not want to invest in another portal, we decided to expand VC Map in a targeted way. We developed the concept, secured funding, and launched an open tender process, in which VCS was awarded the contract to develop the open-source plugin.
The result is the VC Solar App – a web-based tool for both administration and the public. It enables the calculation of solar potential for individually definable areas such as roofs, facades, or open spaces. Citizens can access the application directly online via our public VC Map.
A particular focus was placed on adaptability:
Calculation parameters, visualizations, and layers are all fully configurable by us. The app is thus a living example of digital sovereignty at the municipal level.
Rostock – A Smart City That Brings a Smile to Its Citizens
We understand Smart City not as a technological obligation, but as a space for creativity and participation. Our goal is a “Smile City”: a city where technology serves people, remains transparent, and encourages engagement. The VC Solar App is a strong example of this approach. It is designed equally for specialist departments and for citizens – free of technical barriers, yet rich in data.
“We no longer want a GIS that merely displays data – but one that actively shapes processes. With the VC Suite, we have found the right foundation for that.”
What We Plan Next
We are preparing to expand the platform with targeted, practice-oriented applications. Planned developments include sensor-based evaluations, such as monitoring the use of disabled parking spaces or ensuring fire access routes remain clear. In addition, we aim to integrate Copernicus satellite data into our systems to enable robust climate analyses. We also plan to extend our 3D platform – for example, with functions for infrastructure monitoring and early damage detection.
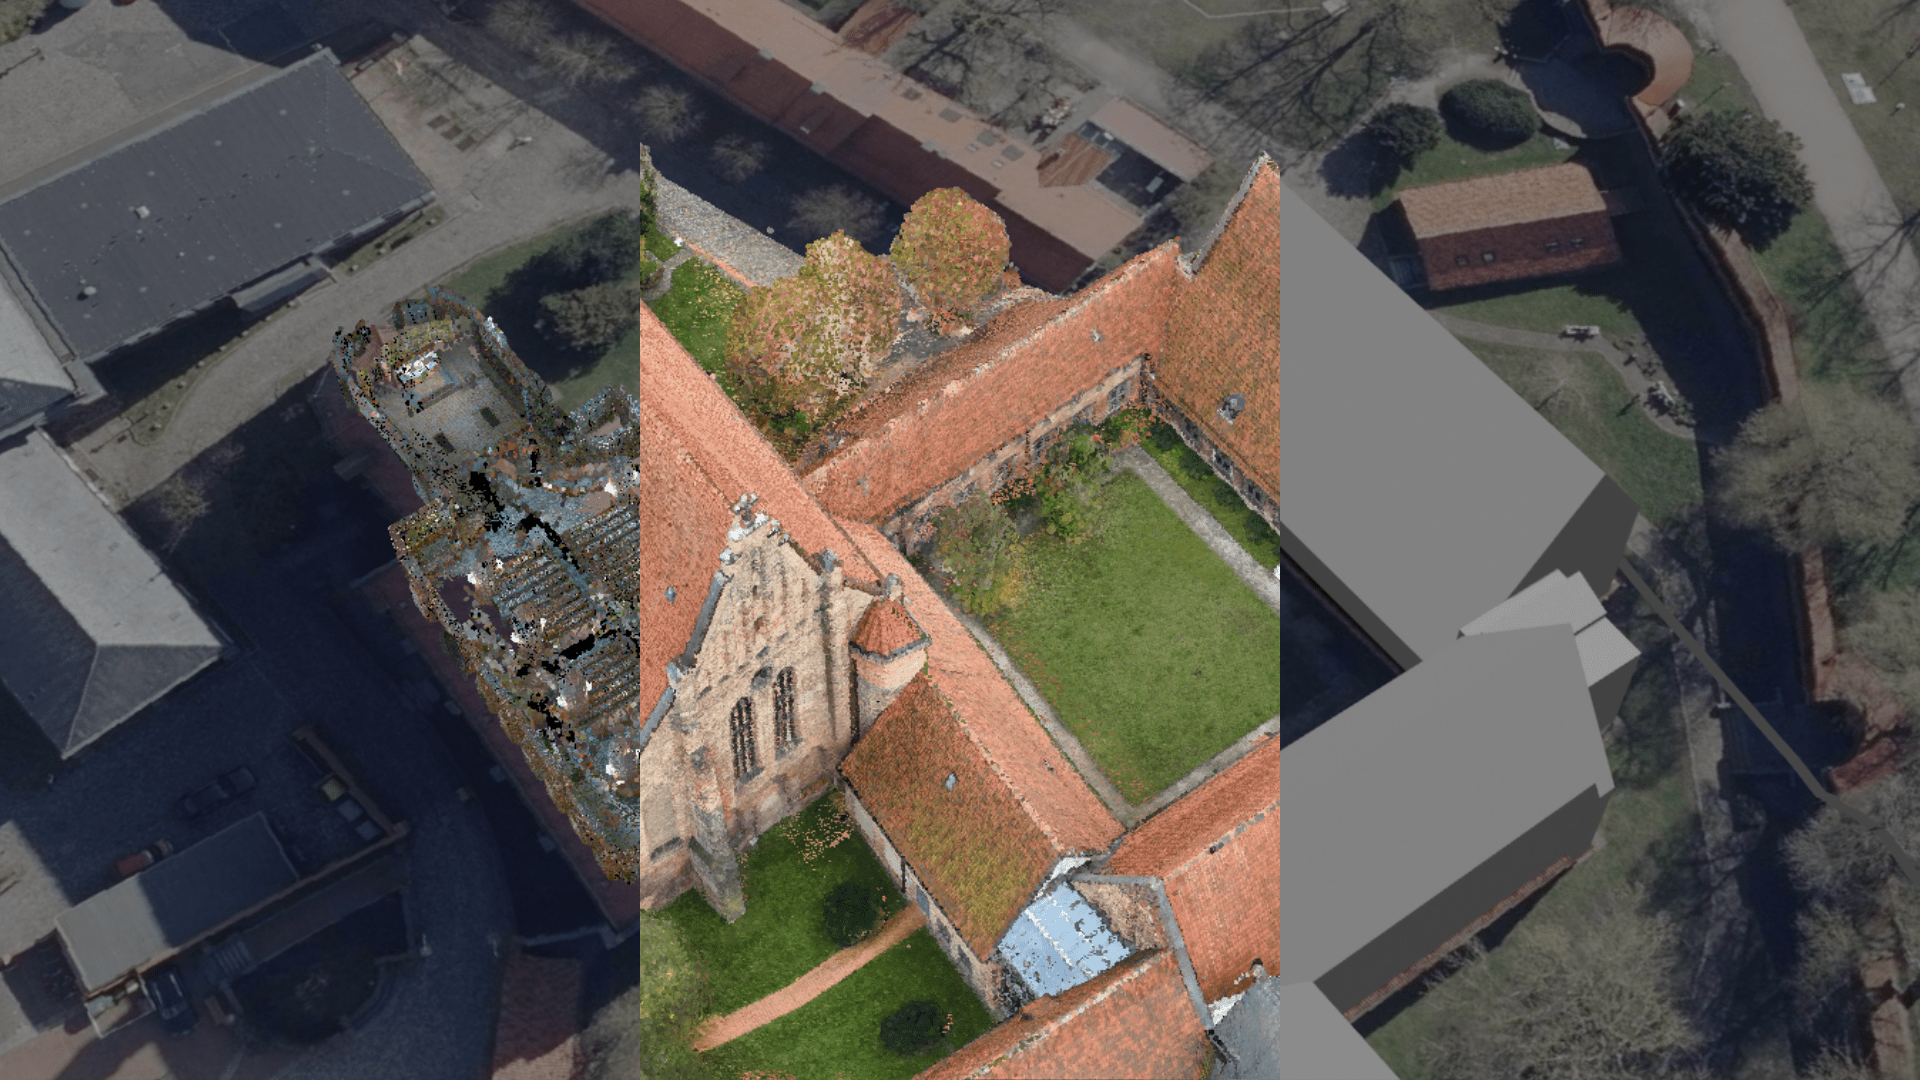
Figure: Das Kloster zum Heiligen Kreuz in Rostock, Darstellung von links nach rechts: Indoor Punktwolke, digitales Oberflachenmodell (DOM) als Punktwolke und LoD2, untexturiert.
VC Suite as the foundation for an open and scalable platform
Are you looking for a performance-driven tool to enhance the capabilities of your city administration? We would be happy to show you how a 3D environment can open up new opportunities for municipal innovation — in administration, climate strategy, and public relations.
“With the VC Suite, Rostock has consistently modularized its digital infrastructure for the Digital Twin, thereby creating new scope for innovation. It is a prime example of how municipal digitalization can be implemented with sovereignty, pragmatism, and strategic vision.”